Figures & data
Figure 1. Apcin suppresses glioma cell proliferation. (a) The CCK-8 assay was performed after treating U251MG cells with the indicated concentrations of apcin for 24, 48 and 72 h. (b) The CCK-8 assay was performed after treating U87MG cells with the indicated concentrations of apcin for 24, 48 and 72 h. (c) Colony formation assay showing the sensitizing effects on GBM cells after apcin treatment. (d) Quantitative results of Colony formation assay (*p < 0.05 vs. the control group, **p < 0.01 vs. the control group)
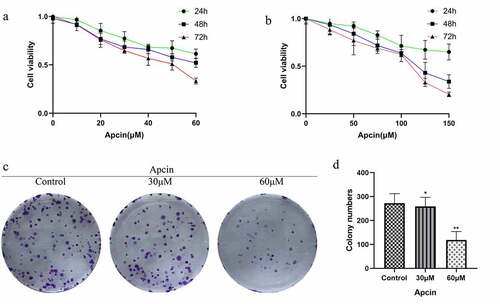
Figure 2. Apcin induces glioma cell apoptosis. (a) U251MG cells were stained with PI and annexin V-FITC for apoptotic analysis after were treated with 0, 30 or 60 μM apcin for 48 h. (b) Quantitative results of colony formation assay. (c, d) The migration ability of GBM cells after apcin treatment was assessed using a wound healing assay. (e, f) The expression of Bim after apcin treatment was detected using western blotting (*p < 0.05 vs. the control group, **p < 0.01 vs. the control group)
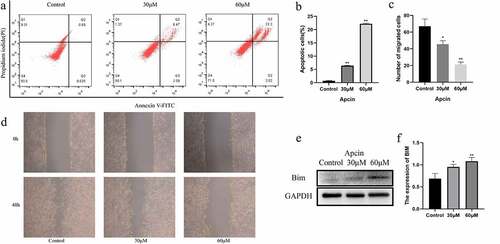
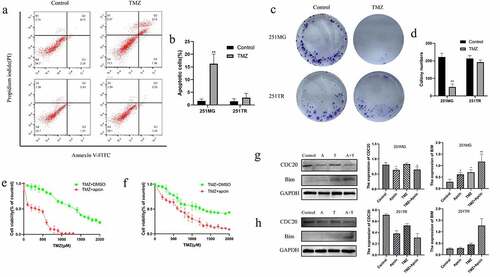
Figure 3. Apcin improves glioma sensitivity to temozolomide. (a, b) U251MG or U251TR cells were exposed to increase the concentrations of TMZ in culture medium for 48 h. Cell viability was measured by a PI/FITC-annexin V assay. (c, d) Colony formation assay showing U251TR cells exhibited lower sensitivity to TMZ than the U251MG cells. (e) U251MG cells were exposed to increase the concentrations of TMZ or TMZ+30 μM apcin in culture medium for 48 h. (f) U251TR cells were exposed to increase the concentrations of TMZ or TMZ+30 μM apcin in culture medium for 48 h. (g,h) Western blot analysis of bim in U251MG/U251TR cells and then treated with TMZ or apcin for 48 h (A: 30 μM apcin, T: 100 μM TMZ, A + T: treated with 30 μM apcin and 100 μM TMZ). Quantitative results of western blotting (*p < 0.05 vs. the control group, **p < 0.01 vs. the control group)