
Figures & data
Table 1. Clinical and demographic characteristic of subjects
Figure 1. Identification of the differentially expressed monocyte-related genes between latent and active tuberculosis. (a) The CIBERSORT algorithm was used to estimate the abundance of 22 immune cell types in the 15 samples. (b) Fraction of monocytes in PBMCs of 6 LTBI and 9 ATB. (c) The volcano plot of the DEGs in PBMCs of 6 latent- and 9 active tuberculosis PBMCs samples
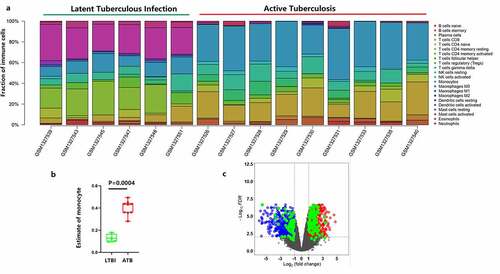
Figure 2. GO and KEGG enrichment analyses for DEMonRGs; BP: Biological Process, CC: Cellular Component, MF: Molecular Function, KEGG: Kyoto Encyclopedia of Genes and Genomes
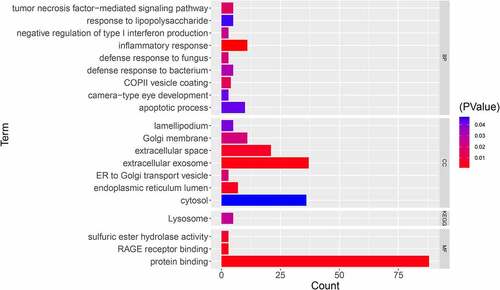
Figure3 The protein-protein interaction network of DEMonRGs. Green represents the down-regulated genes, and red represents the up-regulated genes. Genes in the yellow box represent hub genes
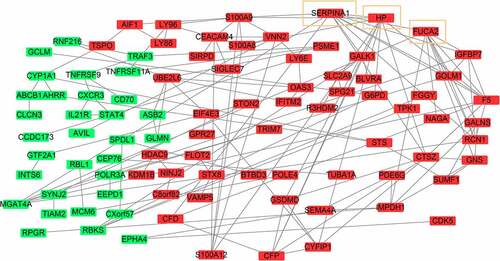
Figure 4. Expression patterns of hub DEMonRGs between latent and active tuberculosis peripheral blood samples. (a) The heat map for unsupervised hierarchical clustering of the three hub DEMonRGs in GSE54992. (b) Validation of the hub DEMonRGs in other GEO datasets
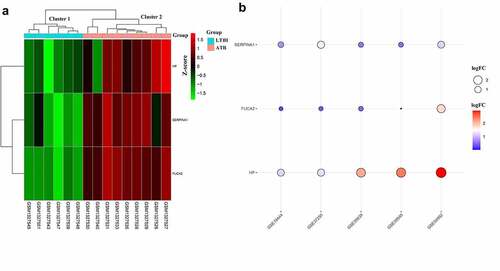
Figure 5. Verification in clinical samples. (a) SERPINA1 mRNA expression in active tuberculosis, latent tuberculosis infection and healthy controls; (b) FUCA2 mRNA expression in active tuberculosis, latent tuberculosis infection and healthy controls; (c) HP mRNA expression in active tuberculosis, latent tuberculosis infection and healthy controls; *represents P < 0.05; ** represents P < 0.01; ***represents P < 0.001; ATB: active tuberculosis, LTBI: latent tuberculosis infection, HC: healthy control. Nonparametric one-way ANOVA(Kruskal-Walls) analyses were performed on measurement of mRNA expression levels
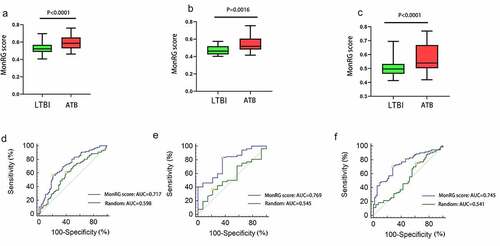
Table 2. ROC analysis of MonRG score and random condition for discrimination between ATB and LTBI group
Figure 6. Diagnostic performance of the MonRG score for patients with active tuberculosis. (A, B, C) MonRG score between patients with active tuberculosis and latent tuberculosis in GSE37250, GSE39939, GSE39940 datasets, respectively. (D, E, F) Receiver operation characteristic curves of MonRG score for diagnosis of between active tuberculosis and latent tuberculosis infection in GSE37250, GSE39939, GSE39940 datasets, respectively. AUC: area under the curve; LTBI: latent tuberculosis infection; ATB: active tuberculosis
Supplemental Material
Download Zip (2.8 MB)Data availability statement
The datasets analyzed during the present study are available from GEO database (http://www.ncbi.nlm.nih.gov/geo/). For further inquiries, please contact the corresponding author.