Figures & data
Table 1. Detailed information of sequencing samples
Figure 1. DEmRNAs analysis of the PCI_NR/PCI_Re group.
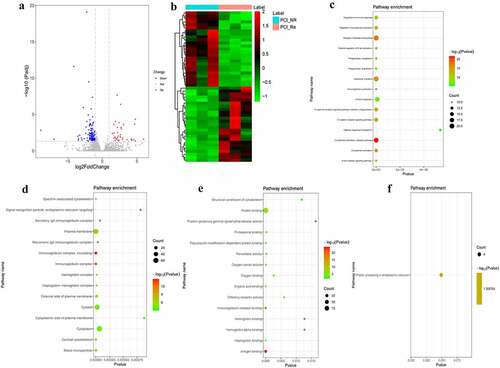
Figure 2. DEmRNAs analysis of the NC/PCI_Re group.
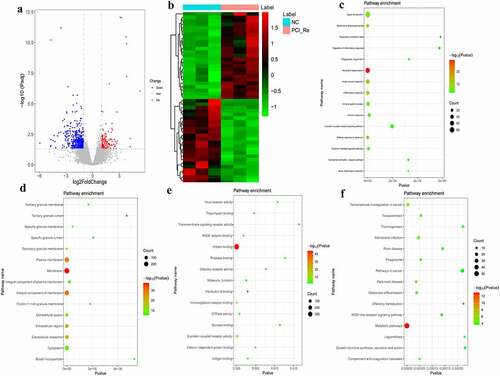
Figure 3. DEmRNAs analysis of the NC/ACS group.
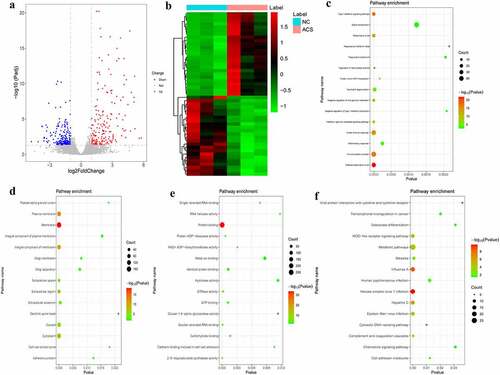
Figure 4. DEmRNAs analysis in ACS/PCI_NR group.
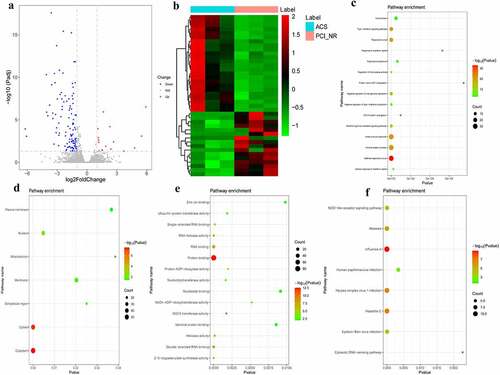
Figure 5. Analysis of DEmRNAs in the intersection of the PCI_NR/PCI_Re and NC/PCI_Re groups.
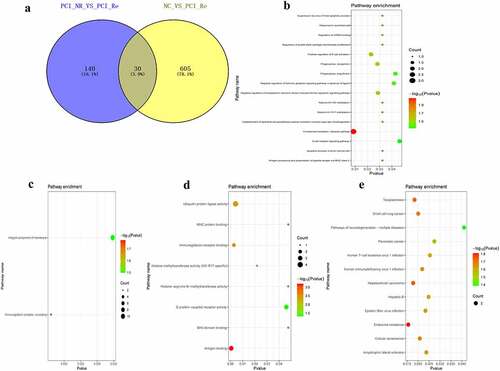
Figure 6. Analysis of DEmRNAs in the intersection of the NC/ACS and ACS/PCI_NR groups.
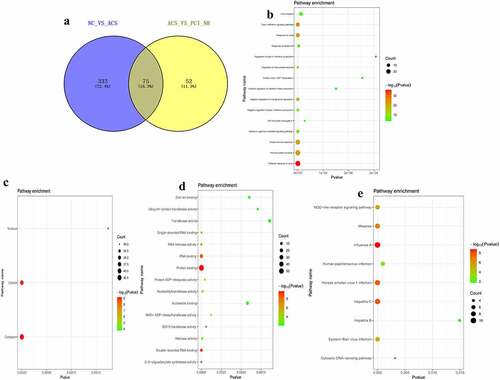
Figure 7. Analysis of DElncRNAs in different groups.
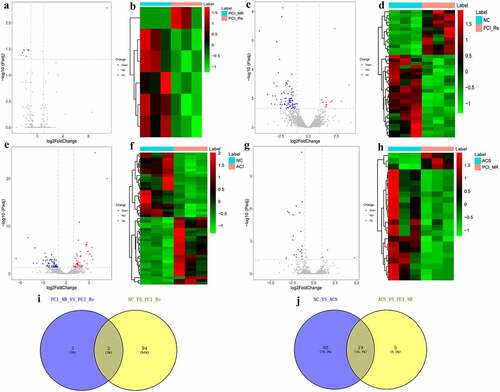
Figure 8. Co-expression analysis of DEmRNA-DElncRNA.
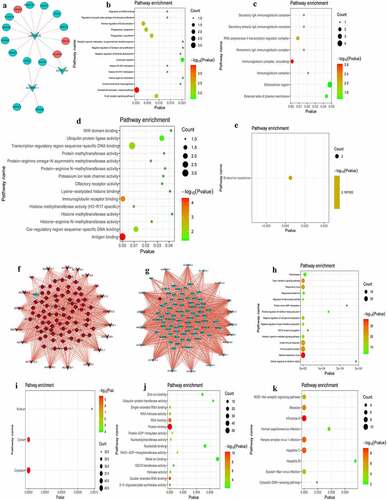
Figure 9. Diagnostic analysis of PDZK1IP1 (a), PROK2 (b) and LAMP3 (c).
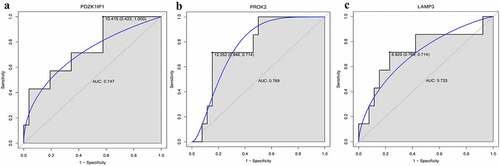
Table 2. The information of 14 individuals for RT-PCR validation
Table 3. Primer sequence in the RT-qPCR
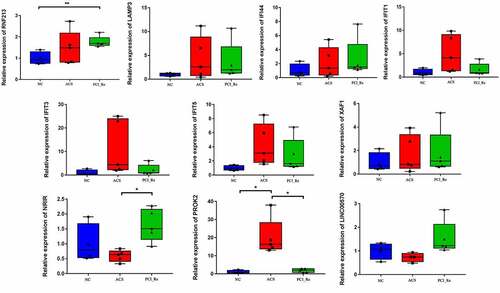
Figure 10. RT-PCR validation of PROK2, LINC00570, RNF213, LAMP3, IFI44, IFIT1, IFIT3, IFIT5, XAF1 and NRIR in blood samples.