Figures & data
Table 1. Primer sequences used for qRT-PCR
Figure 1. ApoE-/- mice fed with a high-fat diet exhibit a more pronounced atherosclerotic plaque. A: Oil Red O staining of atherosclerotic lesions in ApoE-/- mice fed with a high-fat diet and control mice. B: Quantitative lesion areas (Oil Red O positive) are calculated as a percentage of total aorta surface and presented as the mean ± standard deviation of the mean (%), *p < 0.05; There were three mice in each group. C: H&E stained transverse sections of the aortic arch in control (100×). D: H&E stained transverse sections of the aortic arch in ApoE-/- mice fed with a high-fat diet (100×)
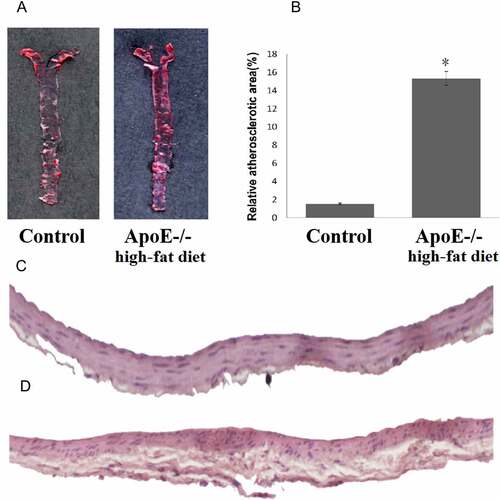
Table 2. ApoE-/- mice fed with a high-fat diet exhibited higher levels of serum lipids except for HDL-C
Figure 2. MiRNAs expression profiling using GeneChip analysis. A: Hierarchical cluster analysis of differentially expressed miRNAs (p < 0.05; n = 3). B: Scatter plot map of differentially expressed miRNAs. Upregulated miRNAs were marked in red, and downregulated miRNAs were marked in green (p < 0.05; n = 3). C: The volcano map overall gene expression. D: Predicted target genes of 24 differentially expressed miRNAs
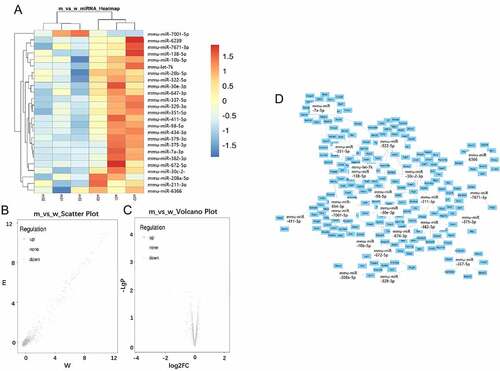
Table 3. Differentially expressed microRNAs with a high significance (p < 0.05,fold change≥2.0)
Figure 3. Gene ontology molecular function enrichment analyses of predicted target genes. A: Target genes of upregulated miRNA. B: Target genes of downregulated miRNAs
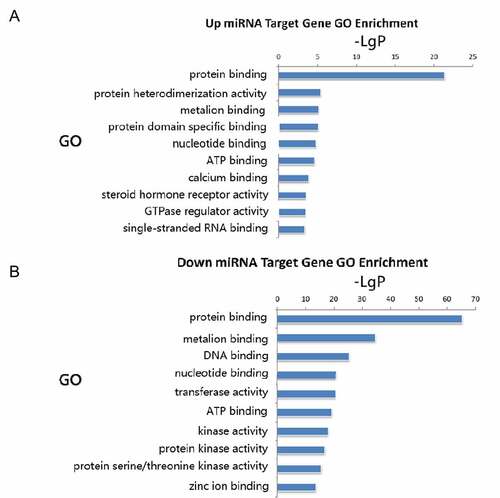
Figure 4. Pathway enrichment analyses of predicted target genes. A: Target genes of up regulated miRNAs. B-D: Target genes of down regulated miRNA
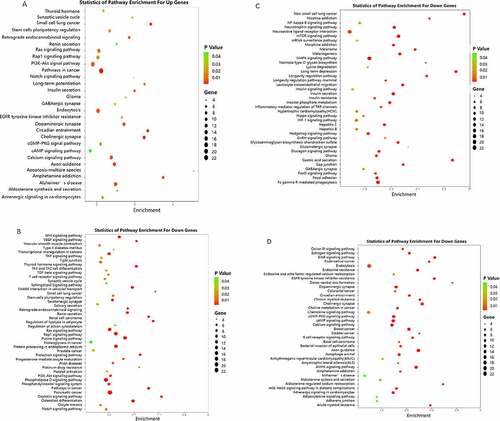
Figure 5. Summary of significantly enriched pathways. A: Target genes of downregulated miRNAs. B: Target genes of upregulated miRNA
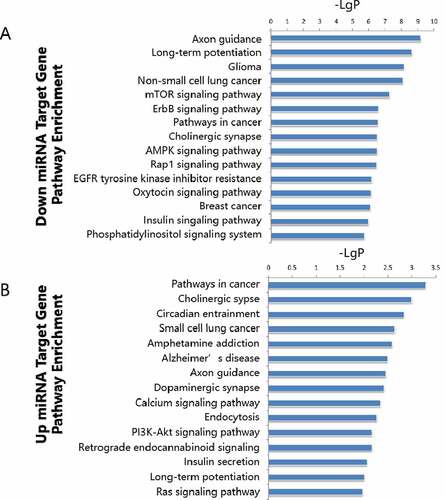
Figure 6. Real-Time qPCR validation of selected miRNAs. *p < 0.01