Figures & data
Figure 1. Effect of LAP on DOX-induced cytotoxicity in H9c2 cells. H9c2 cells were treated with 1 μM DOX with or without 1–3 μM LAP for 24 h. A, Chemical structure of Lapatinib. B, Cytotoxicity effect of LAP on H9c2 cells. C, LDH level in DOX-induced cells with or without different doses of LAP. D and E, Cell apoptosis was detected by TUNEL assay. Original magnification: x200. F, Protein levels of Bcl-2 and Bax were measured by western blot assay. LAP: Lapatinib; DOX: Doxorubicin; LDH: Lactate dehydrogenase. Data are expressed as mean ± SD calculated from three independent experiments. *P < 0.05, ***P < 0.001 versus control. #P < 0.05, ##P < 0.01, ###P < 0.001 versus DOX
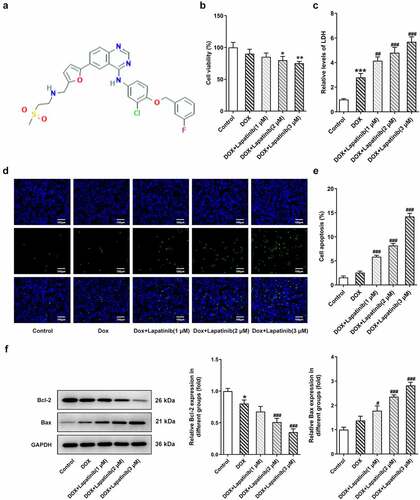
Figure 2. Effect of LAP on DOX-induced mitochondria damage in H9c2 cells. H9c2 cells were treated with 1 μM DOXwith or without 1–3 μM LAP for 24 h. A, MMP was identified by JC-1 staining. Red fluorescence represents the mitochondrial aggregate form of JC-1, indicating intact mitochondrial membrane potential. Green fluorescence represents the monomeric form of JC-1, indicating dissipation of ΔΨm. Original magnification: x200. B, ATP level in DOX-induced cells with or without different doses of LAP. C, Protein level of Cytochrome C was measured by western blot assay. LAP: Lapatinib; DOX: Doxorubicin; MMP: mitochondrial membrane potential. Data are expressed as mean ± SD calculated from three independent experiments. ***P < 0.001 versus control. #P < 0.05, ###P < 0.001 versus DOX
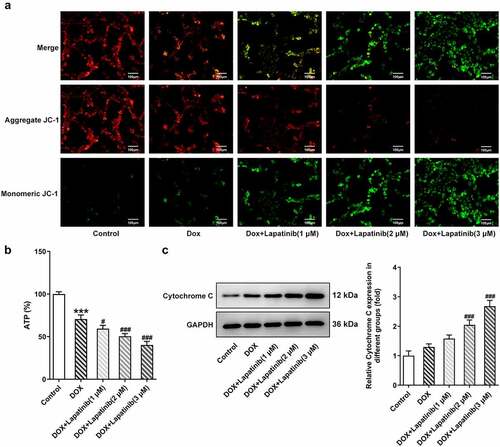
Figure 3. Effect of LAP on DOX-induced oxidative stress in H9c2 cells. H9c2 cells were treated with 1 μM DOXwith or without 1–3 μM LAP for 24 h. A, ROS level was detected by DCFH-DA staining. Original magnification: x200. The activity of SOD (b), CAT (c) and GSH (d) was assessed in DOX-induced cells with or without different doses of LAP. LAP: Lapatinib; DOX: Doxorubicin; ROS: Reactive oxygen species; SOD: superoxide dismutase; CAT: Catalase; GSH: Glutathione. Data are expressed as mean ± SD calculated from three independent experiments. *P < 0.05, **P < 0.01, ***P < 0.001 versus control. #P < 0.05, ##P < 0.01, ###P < 0.001 versus DOX
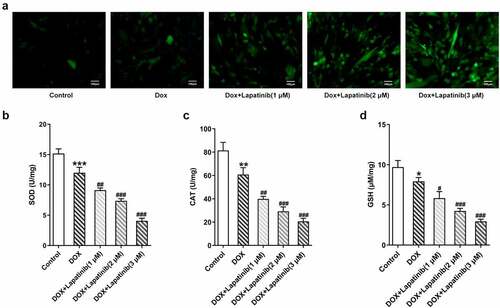
Figure 4. Effect of LAP on DOX-induced ferroptosis in H9c2 cells. H9c2 cells were treated with 1 μM DOXwith or without 1–3 μM LAP for 24 h. A, The level of Fe2+ in DOX-induced cells with or without different doses of LAP. B, Protein levels of GPX4 and ASCL4 were evaluated by western blot assay. LAP: Lapatinib; DOX: Doxorubicin; GPX4: Glutathione peroxidase 4; ASCL4: acyl-CoA synthetase long-chain family member 4. Data are expressed as mean ± SD calculated from three independent experiments. *P < 0.05, **P < 0.01 versus control. #P < 0.05, ##P < 0.01, ###P < 0.001 versus DOX
Figure 5. Effect of LAP on PI3K/AKT signaling pathway in DOX-induced H9c2 cells. H9c2 cells were treated with 1 μM DOXwith or without 1–3 μM LAP for 24 h. Protein levels of p-PI3K, PI3K, p-AKT and AKT were detected by western blot analysis. Data are expressed as mean ± SD calculated from three independent experiments. #P < 0.05, ##P < 0.01, ###P < 0.001 versus DOX
Figure 6. Effects of the activation of PI3K/AKT pathway on mitochondria damage in H9c2 cells with combined treatment of LAP-plus-DOX. 30 μM of 740Y-P was added to H9c2 cells with combined treatment of LAP-plus-DOX. A, MMP was identified by JC-1 staining. Original magnification: x200. B, ATP level in DOX/LAP-induced cells with or without 740Y-P. C, Protein level of Cytochrome C was measured by western blot assay. LAP: Lapatinib; DOX: Doxorubicin; MMP: mitochondrial membrane potential. Data are expressed as mean ± SD calculated from three independent experiments. **P < 0.01 versus control. ##P < 0.01, ###P < 0.001 versus DOX. ΔP < 0.05 versus DOX+Lapatinib (3 μM)
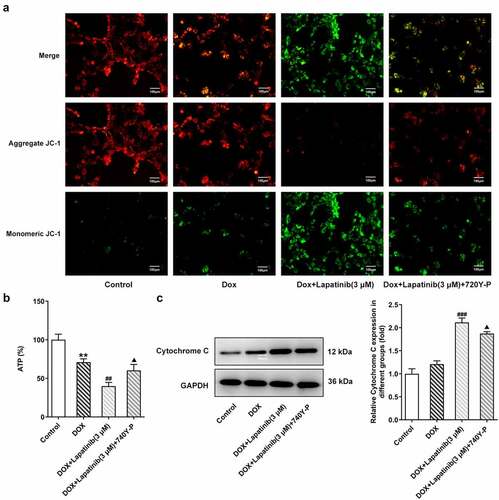
Figure 7. Effects of the activation of PI3K/AKT pathway on oxidative stress in H9c2 cells with combined treatment of LAP-plus-DOX. 30 μM of 740Y-P was added to H9c2 cells with combined treatment of LAP-plus-DOX. A, ROS level was detected by DCFH-DA staining. Original magnification: x200. The activity of SOD (b), CAT (c) and GSH (d) was assessed in DOX/LAP-induced cells with or without 740Y-P. LAP: Lapatinib; DOX: Doxorubicin; ROS: Reactive oxygen species; SOD: superoxide dismutase; CAT: Catalase; GSH: Glutathione. Data are expressed as mean ± SD calculated from three independent experiments. **P < 0.01 versus control. ###P < 0.001 versus DOX. ΔΔΔP < 0.001 versus DOX+Lapatinib (3 μM)
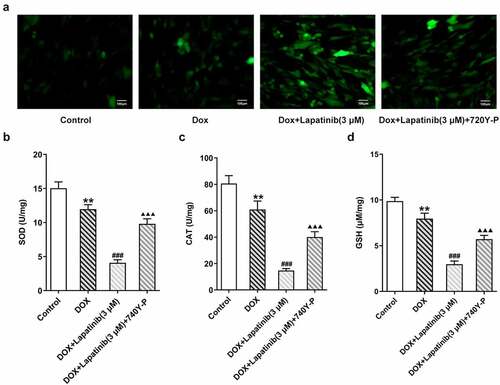
Figure 8. Effects of the activation of PI3K/AKT pathway on ferroptosis in H9c2 cells with combined treatment of LAP-plus-DOX. 30 μM of 740Y-P was added to H9c2 cells with combined treatment of LAP-plus-DOX. A, The level of Fe2+ in DOX/LAP-induced cells with or without 740Y-P. B, Protein levels of GPX4 and ASCL4 were evaluated by western blot assay. LAP: Lapatinib; DOX: Doxorubicin; GPX4: Glutathione peroxidase 4; ASCL4: acyl-CoA synthetase long-chain family member 4. Data are expressed as mean ± SD calculated from three independent experiments. *P < 0.05, **P < 0.01, ***P < 0.001 versus control. ###P < 0.001 versus DOX. ΔΔP < 0.01, ΔΔΔP < 0.001 versus DOX+Lapatinib (3 μM)