
Figures & data
Figure 1. Preparation and identification of engineered exosomes. (a) Exosome characterization was observed using TEM. (b) DLS experiments assessed the size distribution of exosomes. (c) The protein expression of CD63, CD81, and Calnexin
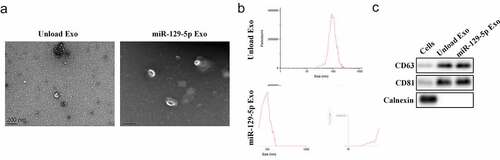
Figure 2. Specific uptake of autogenous exocrine by tumor cells. (a) Colon cancer cells were co-cultured with cancer cell-derived exosomes for 24 h. The exosome uptake of colon cancer cells was confirmed by a confocal microscope (scale, 10 μm). Exosomes were stained by PKH26 (red). Cell nuclei were stained by DAPI (blue). (b) The levels of miR-129-5p were detected by RT-qPCR analysis. ***P < 0.001 vs NC Exo
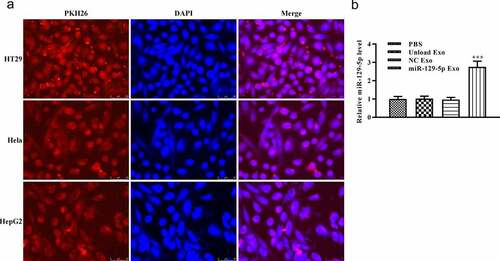
Figure 3. Effects of miR-129-5p-loaded exosomes on tumor cell viability. (a-c) The cell viability was assessed by CCK8 assay in Hela, HepG2, and HT29 cells. **P < 0.01 vs NC Exo
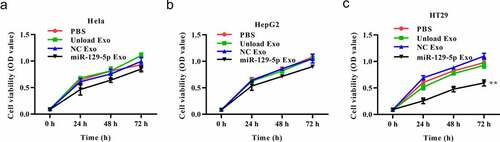
Figure 4. Effect of miR-129-5p-loaded exosomes on apoptosis of tumor cells. (a) The protein levels of Bcl-2, Bax, cleaved caspase-3, and cleaved caspase-9 in colon cancer cells were revealed by Western blot analysis. (b) The relative protein expression levels were quantified by the ImageJ software. (c) TUNEL staining assay was performed on colon cancer cells after treatment with PBS, unloaded exosomes, NC mimics-loaded exosomes, and miR-129-5p-loaded exosomes. **P < 0.01, ***P < 0.001 vs NC Exo
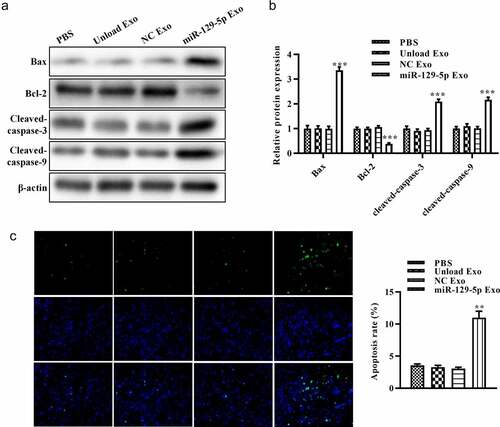
Figure 5. Effect of miR-129-5p-loaded exosomes on tumor cell migration. (a) The lateral migration of colon cancer cells was analyzed using a scratch wound-healing assay. (b) The percentage of wound closure of colon cancer cells. **P < 0.01 vs NC Exo
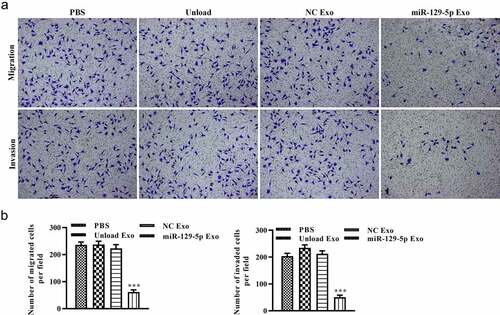
Figure 6. Effect of miR-129-5p-loaded exosomes on tumor cell migration and invasion. (a) The migration and invasion of colon cancer cells was analyzed by Transwell assays. (b) The number of migrated and invaded cells. ***P < 0.001 vs NC Exo
Availability of Data and Material
The datasets during and/or analyzed during the current study available from the corresponding author on reasonable request.