Figures & data
Table 1. The primers for RT-qPCR for each gene
Figure 1. miR-543 and UBE2T can be key players in breast cancer. (a) The Venn diagram showing the intersection between the GSE113740 miRNA profiling and the GSE146477 miRNA profiling. FC: fold-change. (b) The Venn diagram showing the intersection between the GEPIA breast cancer data and the predicted target mRNAs of miR-543 by targetscan algorithm. FC: fold-change. (c) The PPI analysis of the mRNAs in Figure B using STRING algorithm. Line color indicates the type of interaction evidence
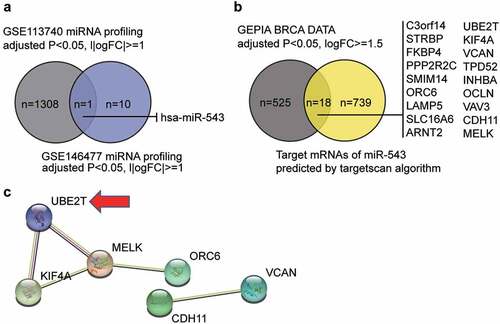
Figure 2. miR-543 inhibited cell viability and proliferation in breast cancer. (a) Expression level of miR-543 in breast cancer tissues and normal tissues by qRT-PCR. **P < 0.001 versus normal tissues, n = 36. (b) miR-543 expression was also measured in Human normal mammary epithelial cells (MCF-10A) and breast cancer cell lines (HCC1937, MCF-7, MDA-MB-231). **P < 0.001 versus MCF-10A cells. (c) miR-543 mimics transfection efficiency was detected by qRT-PCR. (d) Cell viability was detected by CCK-8 assay. (e) Cell proliferation was detected by BrdU assay. (c-e) **P < 0.001 versus blank control group. Blank: blank control. NC: negative control. mimic: miR-543 mimic
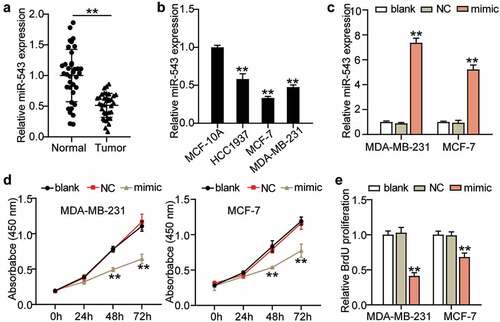
Figure 3. miR-543 had a negative effect on cell migration and invasion in breast cancer. (a) Cell migration was detected by wound healing assay. (b) Cell invasion was detected by transwell invasion assay. (a-b) *P < 0.05, **P < 0.001 versus blank control group. Blank: blank control. NC: negative control. mimic: miR-543 mimic. (c) Subcutaneous tumors in nude mice derived with MDA-MB-231 cells transfected with miR-543 agomir and NC agomir. (d) tumor volumes of the subcutaneous tumors. **P < 0.001. NC: negative control
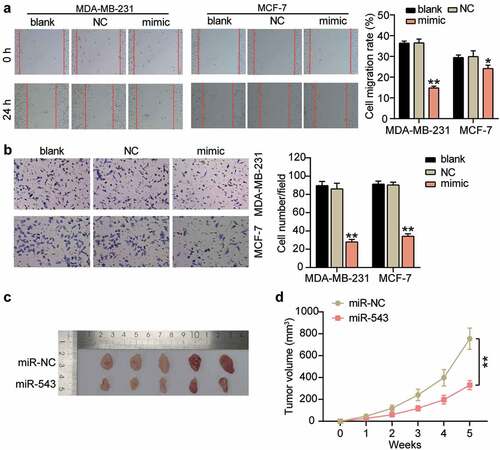
Figure 4. miR-543 targeted UBE2T in breast cancer cells. (a) The binding sites between miR-543 and UBE2T were predicted by TargetScan. (b) Dual-luciferase reporter assay was conducted to confirm the relationship between miR-543 and UBE2T. **P < 0.001 versus miR-NC group. NC: negative control. WT: wild type, MUT: mutation. (c) Expression level of UBE2T in breast cancer tissues and normal tissues by qRT-PCR. **P < 0.001. n = 36. (d) Pearson’s correlation analysis was used to determine the relationship between expression of miR-543 and UBE2T in breast cancer tissues. (e) RNA pull-down assay was carried out to quantify the UEB2T enrichment in MDA-MB-231 and MCF-7 transfected with bio-miR-543 or bio-miR-NC. Bio-miR-543: Biotin-labeled miR-543. Bio-NC: Biotin-labeled negative control. **P < 0.001 versus bio-NC group. (f) The expression level of UBE2T in MDA-MB-231 and MCF-7 transfected with miR-543 mimic or inhibitor was detected by Western blot, **P < 0.001 versus mimic-NC group. **P < 0.001 versus inhibitor-NC group
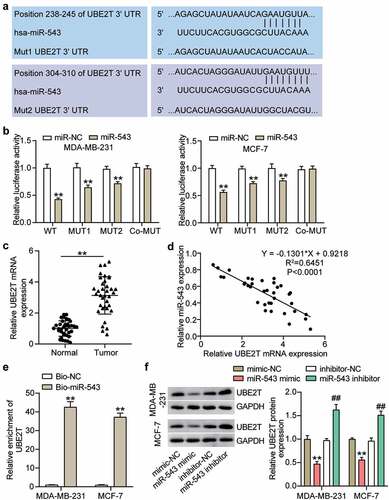
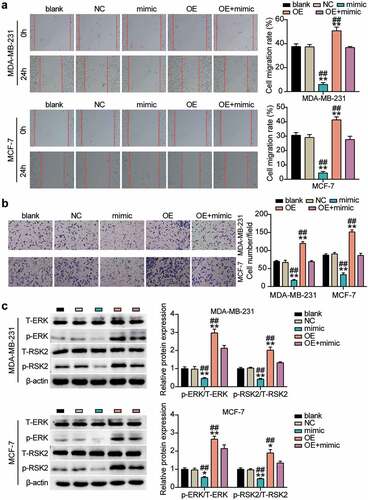
Figure 5. miR-543 repressed UBE2T to inhibit cell viability and proliferation in breast cancer cells. (a) The transfection efficiency of UBE2T overexpression plasmid was detected by Western blotting. (b) Cell viability was detected by CCK-8 assay. (c) Cell proliferation was detected by BrdU assay. **P < 0.001 versus blank group. #P < 0.05, **P < 0.001 versus OE+mimic group. Blank: blank control. NC: negative control. OE: UBE2T overexpression vector. Mimic: miR-543 mimic
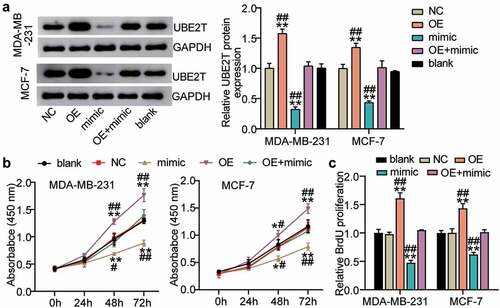
Figure 6. miR-543 repressed UBE2T to inhibit cell migration and invasion in breast cancer cells. (a) Cell migration was detected by wound healing assay. (b) Cell invasion was detected by transwell invasion assay. **P < 0.001 versus blank group. **P < 0.001 versus OE+mimic group. Blank: blank control. NC: negative control. OE: UBE2T overexpression vector. Mimic: miR-543 mimic. (c) Western blot experiment was performed to detect the activity of ERK/MAPK pathway. **P < 0.001 vs negative control