
Figures & data
Figure 1. Schematic diagram for structure of pCDNA3.1-VS-1 NP
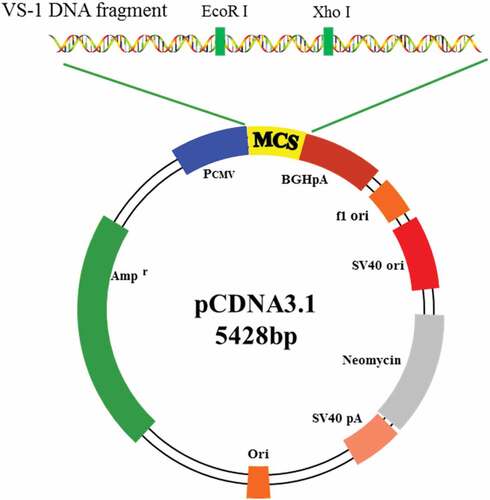
Figure 2. Preparation of carrying pCDNA3.1-VS-1 NP
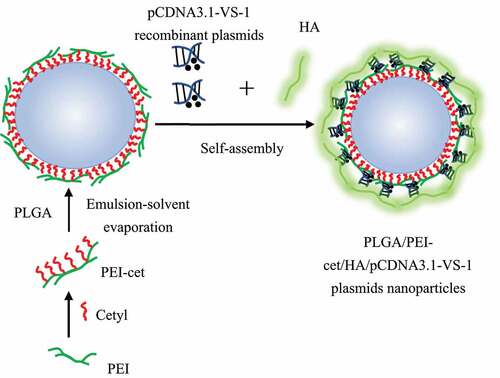
Figure 3. AMPK/mTOR SP
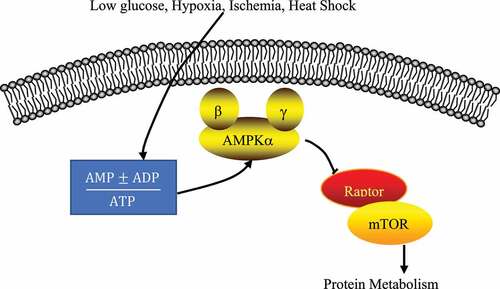
Figure 4. Amplification of VS-1 DNA with PCR
Figure 5. Identification results after digestion of pCDNA3.1-VS-1 NP
Figure 6. DNA sequencing of pCDNA3.1-VS-1 NP
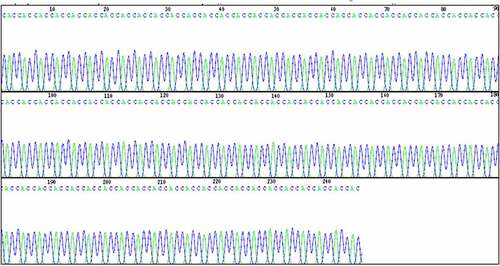
Figure 7. Microscopic morphologic surface of VS-1 NP
Figure 8. Curve for particle size distribution
Figure 9. Cumulative release curve
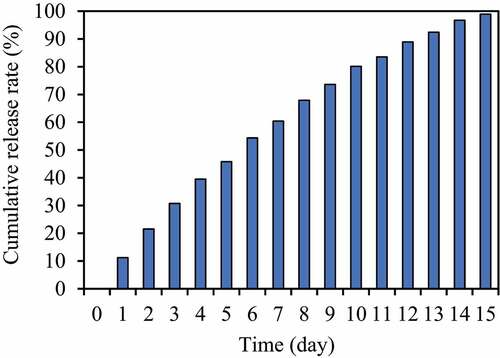
Figure 10. Incidence of AAA and DE for rats in each group
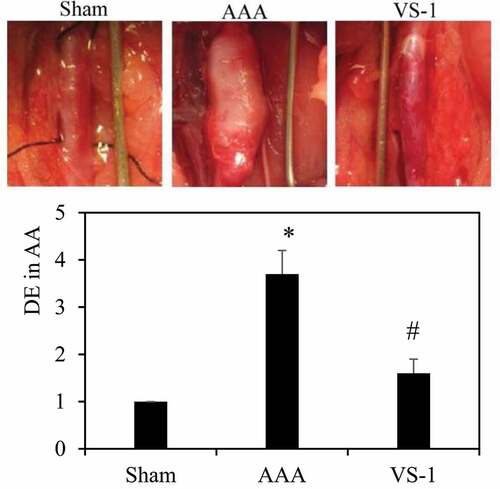
Figure 11. Comparison on HE staining results of AA for rats in each group (100 ×)
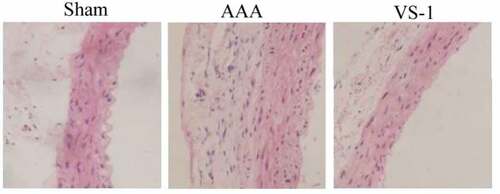
Figure 12. Comparison on immunohistochemical results of AMPK of rats in each group
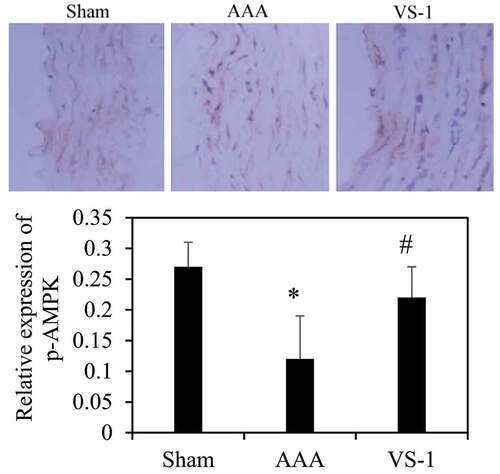
Figure 13. Comparison on immunohistochemical results of mTOR of rats in each group
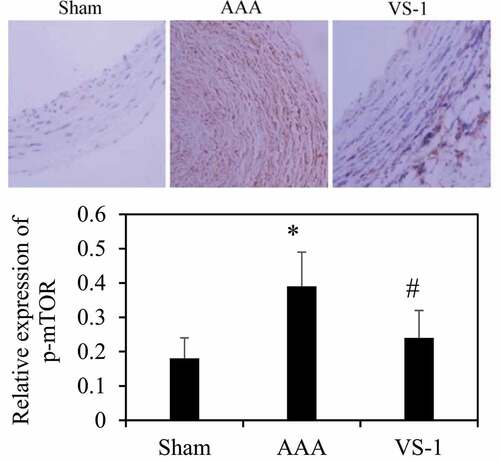
Figure 14. Comparison on p-AMPK PE in AA in each group
Figure 15. P-mTOR PE in AA in each group
Figure 16. Correlation between p-AMPK PE and ED of rats in all groups
Figure 17. Correlation between p-mTOR PE and ED of rats in all groups
Data availability statement
All data, models, and code generated or used during the study appear in the submitte.