
Figures & data
Table 1. Clinicopathological characteristics of participants
Table 2. Primers used for RT-qPCR
Table 3. Sequence used for transfection
Figure 1. MiR-34a is upregulated in OA cartilage tissues and chondrocytes. (a) Differentially expressed miRNAs in cartilage tissues by miRNA microarray (listed by foldchange), among which 7 were upregulated (miR-34a, miR-92a, miR-196b, miR-543, miR-103a, miR-107, miR-15b), whereas 3 were downregulated (miR-424, miR-195, miR-6838). (b) Detection of miR-34a expression in OA cartilage tissues by RT-qPCR where normal = 31, OA = 55. (c) miR-34a localization and activity in tissues by in situ hybridization. (d) Expression of ECM degradation markers in OA cartilage tissues by RT-qPCR where normal = 31, OA = 55. (e) PCR detection of pro-inflammatory factor expression in OA cartilage tissues where normal = 31, OA = 55. (f) Person’s correlation analysis of correlation between miR-34a expression and ECM degradation markers and inflammatory factors. (g) miR-34a expression in OA chondrocytes by RT-qPCR. Data are expressed as the mean ± SD of three independent experiments. *p < 0.05 compared with normal cartilage tissues or chondrocytes by unpaired t-test (panels B and G) or one-way ANOVA (panels D and E)
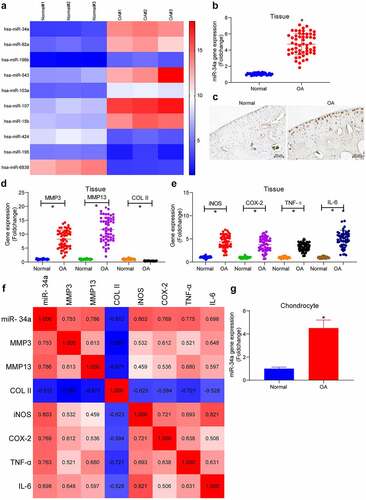
Figure 2. MCL1 is a putative target of miR-34a. (a) Gene Ontology (GO) enrichment analysis of miR-34a target genes. (b) Kyoto Encyclopedia of Genes and Genomes (KEGG) pathway enrichment analysis of miR-34a target genes. (c) Overlapping results of GO analysis and KEGG analysis by Venn analysis. (d) the relationship between miR-34a and MCL1 verified by dual-luciferase assay. (e) Detection of MCL1 expression in cartilage tissues by RT-qPCR where normal = 31, OA = 55. (f) Person’s correlation analysis of correlation between MCL1 and miR-34a in cartilage tissues. (g) Person’s correlation analysis of correlation between MCL1 expression and ECM degradation markers and inflammatory factors. (h) MCL1 expression in chondrocytes with miR-34a inhibitor by RT-qPCR. Data are expressed as the mean ± SD of three independent experiments. *p < 0.05 compared with normal cartilage tissues, chondrocytes or miR-34a control by unpaired t-test (panel E) or two-way ANOVA (panels D and H)
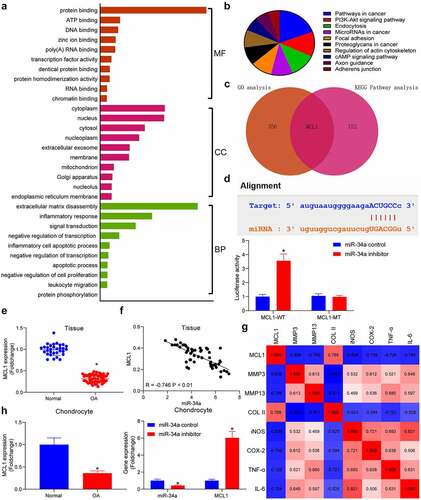
Figure 3. DNMT3B is involved in the upregulation of miR-34a in OA. (a) Bioinformatics analysis of the methylation region of miR-34a. (b) the promoter methylation level of miR-34a in cells examined using qMSP. (c) Detection of DNMT3B expression in OA chondrocytes by RT-qPCR. (d) the binding relationship between DNMT3B and miR-34a verified using ChIP assay. (e) Detection of DNMT3B expression in OA cartilage tissues by RT-qPCR where normal = 31, OA = 55. (f) Person’s correlation analysis of the correlation between DNMT3B and miR-34a expression or MCL1. (g) PCR detection of DNMT3B, miR-34a and MCL1 expression in response to si-DNMT3B. Data are expressed as the mean ± SD of three independent experiments. *p < 0.05 compared with normal cartilage tissues, chondrocytes or DNMT3B-NC by unpaired t-test (panels B, C and E) or two-way ANOVA (panels D and G)
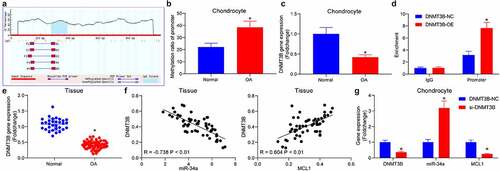
Figure 4. DNMT3B/miR-34a/MCL1 axis regulates the viability of chondrocytes. Chondrocytes or rats (n = 5 for each group) were delivered with miR-34a inhibitor, miR-34a inhibitor + si-DNMT3B, miR-34a inhibitor + si-MCL1 or their respective controls. (a) Expression of DNMT3B and MCL1 in chondrocytes after transfection. (b) CCK8 assay for cell proliferation activity. (c) Detection of apoptotic activity by flow cytometry. (d) Detection of cartilage damage in OA rats in vivo by Safranin O staining. (e) miR-34a expression in rat cartilage tissues (left) examined by RT-qPCR and the protein expression of DNMT3B and MCL1 in rat cartilage tissues examined using Western blot (right). (f) Detection of cartilage damage in OA rats by Safranin O staining. Data are expressed as the mean ± SD of three independent experiments. *p < 0.05 compared with miR-34a control, #p < 0.05 compared with miR-34a in + NC by unpaired t-test (panel D), one-way (panels B, C and F) or two-way ANOVA (panel E)
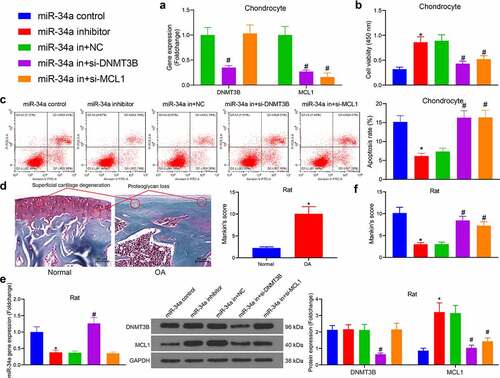
Figure 5. DNMT3B/miR-34a/MCL1 axis regulates the degradation of ECM. (a) Detection of ECM degradation-related markers in chondrocytes by RT-qPCR. (b) ECM degradation examined using Toluidine blue staining where red arrows indicate chondrocytes and yellow arrows indicate ECM. (c) cartilage ECM degradation in rats assessed using Western blot. Data are expressed as the mean ± SD of three independent experiments. *p < 0.05 compared with miR-34a control, #p < 0.05 compared with miR-34a in + NC by one-way ANOVA
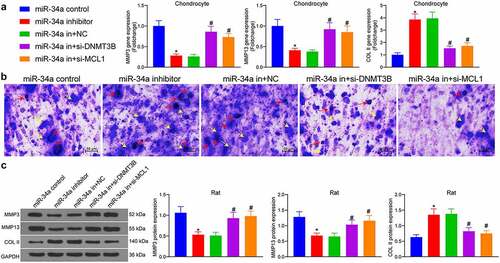
Figure 6. DNMT3B/miR-34a/MCL1 axis regulates the inflammatory response in OA. (a) expression of inflammatory factors in chondrocytes by ELISA. (b) The concentration of TNF-α and IL-6 in synovial fluid of rats measured by ELISA. (c) Relative OD value of iNOS and COX-2 in cartilage tissues examined using immunohistochemical detection. (d) The cartilage tissue damage (circled out) and inflammatory cell infiltration measured using HE staining. Data are expressed as the mean ± SD of three independent experiments. *p < 0.05 compared with miR-34a control, #p < 0.05 compared with miR-34a in + NC by one-way ANOVA
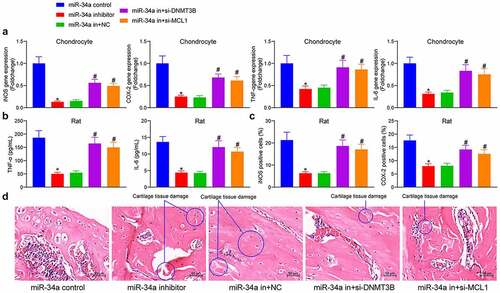
Figure 7. DNMT3B/miR-34a/MCL1 axis governs the activation of the PI3K/AKT pathway in OA. The expression of total and phosphorylated PI3K and AKT in chondrocytes (a) and OA rats (b) measured using Western blot. Data are expressed as the mean ± SD of three independent experiments. *p < 0.05 compared with miR-34a control, #p < 0.05 compared with miR-34a in + NC by two-way ANOVA
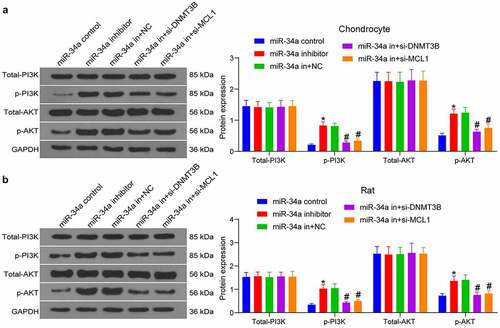
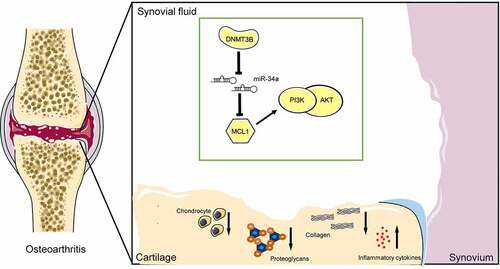
Figure 8. A model for the proposed role of miR-34a in OA. Inhibition of MCL1 expression by miR-34a impaired the PI3K/AKT pathway and promoted OA progression by inhibiting chondrocyte activity, promoting proteoglycan and collagen loss, and increasing inflammatory factor concentrations. DNMT3B, on the other hand, inhibits miR-34a via epigenetic suppression
Availability of data and materials
All the data generated or analyzed during this study are included in this published article.