Figures & data
Table 1. The characteristics of the clinical samples used in this study
Table 2. Sequence of the primers used in this study
Figure 1. MiR-18a-3p is associated with OP and osteogenic differentiation (a) miR-18a-3p expression level in OP-no-Frt and OP-Frt was determined through qRT-PCR. **P < 0.001. (b) miR-18a-3p expression level in hBMSCs osteogenesis was detected via qRT-PCR. (c) ALP activity of cells described in hBMSCs osteogenesis. (d) Osteogenesis related genes ALP was detected in hBMSCs osteogenesis by qRT-PCR. (e) ARS was applied to quantify the bone mineralization ability of hBMSCs. (f-h) Osteogenesis related genes RUNX2 (f), OCN (g) and OPN (h) were detected in hBMSCs osteogenesis by qRT-PCR. (i). ELISA analysis of OCN expression in culture medium at different time. (j) Western blotting analysis demonstrating Collagen I and II expression in hBMSCs osteogenesis.*P < 0.05 vs. 0 day; **P < 0.001 vs. 0 day.
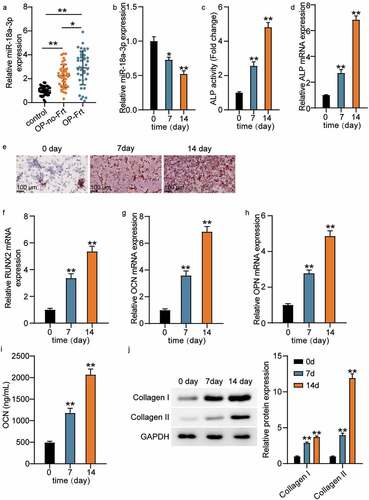
Figure 2. The low expression of miR-18a-3p promotes osteogenic differentiation, while overexpression of miR-18a-3p inhibits osteogenic differentiation. (a) miR-18a-3p level was determined by qRT-PCR in hBMSCs transfected with NC, miR-18a-3p inhibitor and miR-18a-3p mimic. (b) Cell viability of hBMSCs transfected with NC, miR-18a-3p inhibitor and miR-18a-3p mimic was measured by CCK-8 assay. (c) ALP activity of cells described in hBMSCs transfected with NC, miR-18a-3p inhibitor and miR-18a-3p mimic. (d) Osteogenesis related genes ALP was detected in hBMSCs transfected with NC, miR-18a-3p inhibitor and miR-18a-3p mimic by qRT-PCR. (e) ARS was applied to quantify the bone mineralization ability of hBMSCs transfected with NC, miR-18a-3p inhibitor and miR-18a-3p mimic. (f-h) Osteogenesis related genes RUNX2 (f), OCN (g) and OPN (h) were detected in hBMSCs transfected with NC, miR-18a-3p inhibitor and miR-18a-3p mimic by qRT-PCR. (i) ELISA analysis of OCN expression in culture medium of different groups. (j). Western blotting analysis demonstrating Collagen I and II expression in hBMSCs osteogenesis in different groups. *P < 0.05, **P < 0.001 vs. blank.
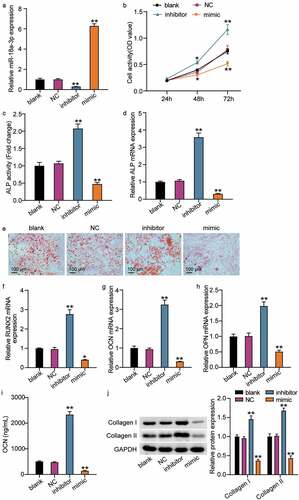
Figure 3. GRIA1 is a target mRNA of miR-18a-3p. (a) Schematic picture of miR-18a-3p and GRIA1 3ʹ-UTR. (b) Luciferase activity were detected in hBMSCs containing WT or mutated GRIA1 3ʹ-UTR and transfected with miR-18a-3p mimic or mimic NC. **P < 0.001 vs. miR-NC. (c) RNA pull-down was used to validate the enrichment of GRIA1 in miR-18a-3p. **P < 0.001 vs. Bio-NC. (d) GRIA1 expression level in OP-no-Frt and OP-Frt was determined through qRT-PCR. **P < 0.001. (e) The correlation of miR-18a-3p and GRIA1 in OP-no-Frt was analysis by Pearson. (f) The correlation of miR-18a-3p and GRIA1 in OP-Frt was analysis by Pearson. (g) GRIA1 expression level in hBMSCs osteogenesis was detected via qRT-PCR. **P < 0.001 vs. 0 day. (h) GRIA1 expression level in hBMSCs osteogenesis was detected via Western blot. *P < 0.05, **P < 0.001 vs. 0 day. (i) GRIA1 expression level was determined by qRT-PCR in hBMSCs transfected with NC, miR-18a-3p inhibitor and miR-18a-3p mimic. *P < 0.05, **P < 0.001 vs. blank. (j) GRIA1 expression level was determined by Western blot in hBMSCs transfected with NC, miR-18a-3p inhibitor and miR-18a-3p mimic as indicated. *P < 0.05, **P < 0.001 vs. blank.
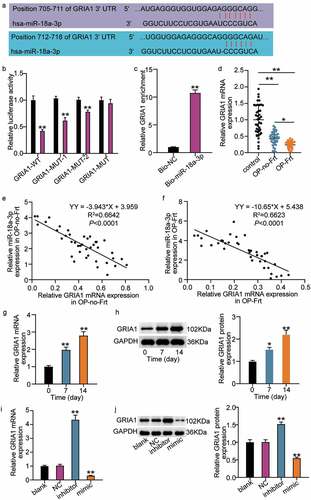
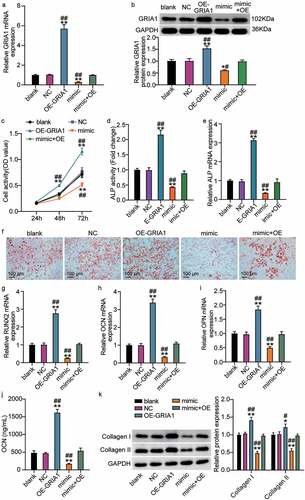
Figure 4. miR-18a-3p controls osteogenic differentiation through GRIA1. (a) GRIA1 expression level was determined by qRT-PCR in hBMSCs transfected with miR-18a-3p mimic or OE-GRIA1. (b) GRIA1 expression level was determined by Western blot in hBMSCs transfected with miR-18a-3p mimic or OE-GRIA1. (c) Cell viability of hBMSCs transfected with miR-18a-3p mimic or OE-GRIA1 was measured by CCK-8 assay. (d) ALP activity of cells described in hBMSCs transfected with miR-18a-3p mimic or OE-GRIA1. (e) Osteogenesis related genes ALP was detected in hBMSCs transfected with miR-18a-3p mimic or OE-GRIA1 by qRT-PCR. (f) ARS was applied to quantify the bone mineralization ability of hBMSCs transfected with miR-18a-3p mimic or OE-GRIA1. (g-i) Osteogenesis related genes RUNX2 (g), OCN (h) and OPN (i) were detected in hBMSCs transfected with miR-18a-3p mimic or OE-GRIA1 by qRT-PCR. (j). the osteogenic marker OCN was detected by ELISA. (k). Western blotting analysis demonstrating Collagen I and II expression in hBMSCs osteogenesis in different groups. *P < 0.05, **P < 0.001 vs. blank.##P < 0.05, ##P < 0.001 vs. mimic + OE.