Figures & data
Table 1. CFB expression associated with clinicopathological variables (N = 65)
Figure 1. Correlation of StromalScore and ImmuneScore with clinicopathological staging characteristics
(a-c) Distribution of estimate scores, stromal scores, and immune scores in tumor TNM stage.
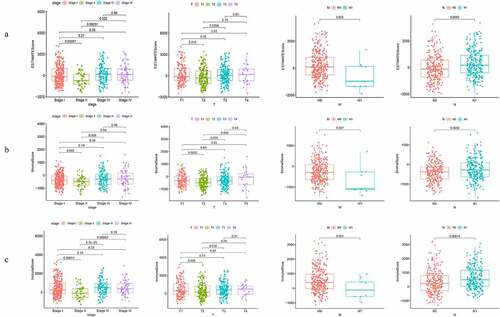
Figure 2. High score groups and low score groups and enrichment analysis of GO and KEGG for DEGs
(a, b) Heatmaps for DEGs in stromal scores and immune scores. Venn diagrams drawn from up-regulated (c) and down-regulated (d) DEGs in stromal scores and immune scores. (e, f, and g) GO term enrichment analysis results of DEGs. (h, i, j) KEGG term enrichment analysis results of DEGs.
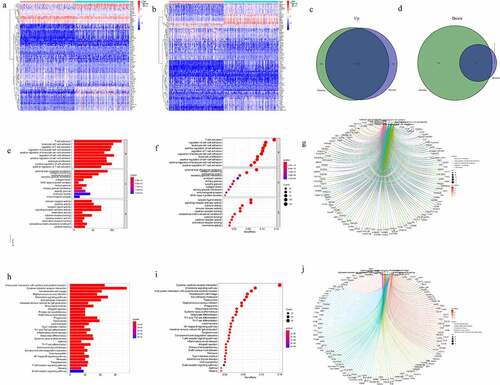
Figure 3. Protein–protein interaction network and univariate Cox regression analysis
(a) PPI network of the DEGs based on STRING with interaction confidence value > 0.99. (b) Visualized PPI analysis of DEGs based on Cytoscape. (c) The top 30 genes with maximum-ordered nodes. (d) Univariate Cox regression analysis of DEGs, listing the genes with p < 0.05 in the forest plot. (e) Venn diagram showing the key gene (CFB) in PPI and Univariate Cox regression analysis.
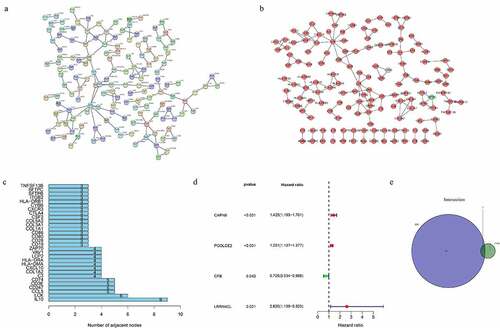
Figure 4. CFB expression levels and the survival and clinical correlation analysis of THCA patients
(a) The expression of CFB in the normal and tumor samples. (b) The expression level of CFB in paired normal and tumor samples. (c) Survival analysis with different CFB expression in high expression and low-expression groups. The expression of CFB with stage (d), T classification (e), M classification (f), N classification (g).
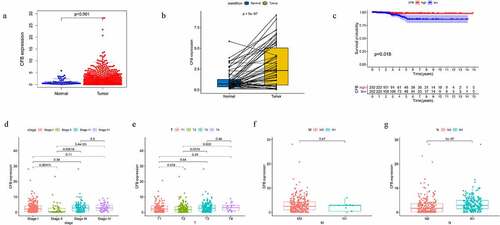
Figure 5. TIC profile and correlation analysis in TME
(a) Bar plot showing the components of TICs in THCA samples. (b) The proportions of TICs in THCA samples were displayed in correlation matrix.
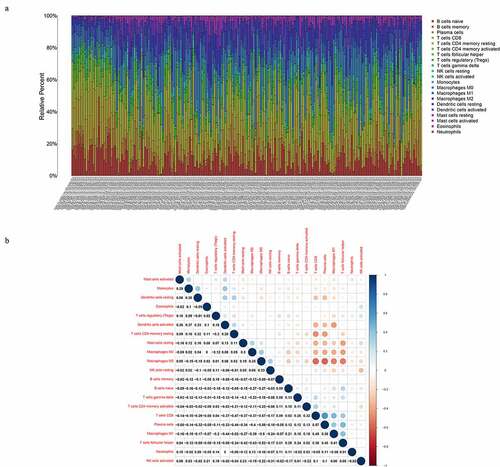
Figure 6. Correlation of immune cell infiltration levels with CFB expression
(a) Violin plot showing the ratio differentiation of different TICs -ith high CFB expression and low expression relative to the median expression level. (b) Scatter plot showing the correlation of 11 kinds of TICs with the CFB expression (p < 0.05). (c) Venn plot showed that nine kinds of TICs correlated with CFB expression codetermined by difference analysis that displayed in violin plot and correlation analysis, which displayed in scatter plots.
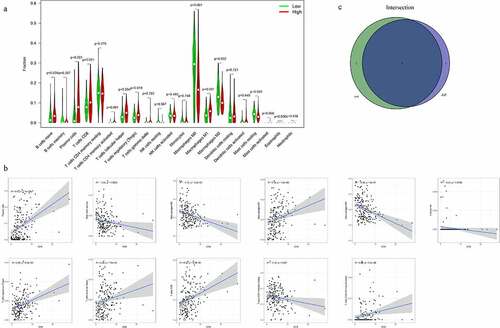
Figure 7. Expression of CFB in different GEO datasets
The expression levels of CFB in normal and PTC tissues from the GSE33630, GSE29265, GSE35570, and GSE27155.
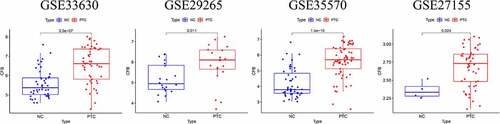
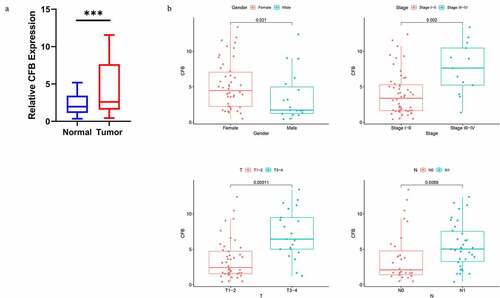
Figure 8. qRT-PCR verification of CFB expression between THCA tissues and adjacent normal tissues
(a) The relative expression of CFB in 65 pairs tumorous and adjacent normal tissues. ***P < 0.001. (b) The correlations between CFB expression and gender, clinical stage, T stage, and N stage.