Figures & data
Figure 1. Arbutin administration reduced body weight and DAI score. Mice in DSS group were gavaged with 3% DSS solution at a volume of 15 mL/kg continuously for 7 days and the mice in DSS + Arbutin group were also administrated with abutin 50 mg/kg or 100 mg/kg for 7 days by intragastric administration, once a day. Body weight (a) and DAI score (b) were recorded every day. The values presented are mean ± SD (n = 10/each group). ***P < 0.001
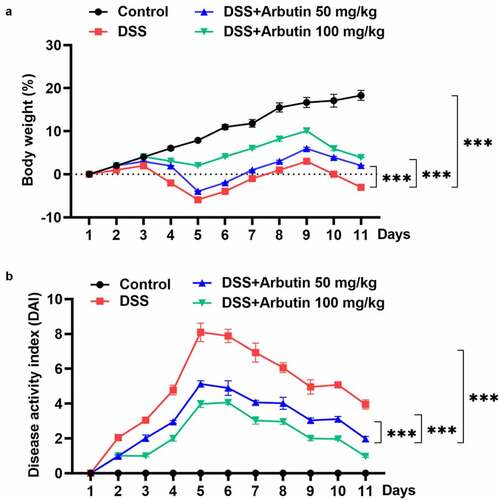
Figure 2. Arbutin improved intestinal injury and increased colon length. Intestinal histopathology (a) was observed in each group through HE staining. The colon length (b). The colon is removed and photographed (c, d). The data were shown in mean ± SD (n = 10/each group). ***P < 0.001 versus DSS (-). ##P < 0.01 versus DSS (+) + Arbutin (-)
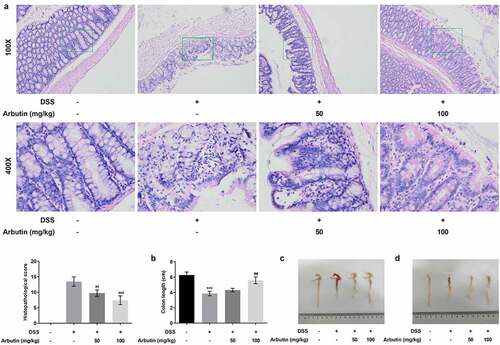
Figure 3. Arbutin altered the levels of inflammatory factors of colon tissue. The detection of inflammation-related factors(a). MPO activity (b). The data were shown in mean ± SD (n = 10/each group). ***P < 0.001 versus DSS (–). ###P < 0.001 versus DSS (+) + Arbutin (–)
Figure 4. Arbutin decreased apoptosis levels of colon tissue. Tunel staining (a, b). The detection of apoptosis-related proteins (c). The data were presented in mean ± SD (n = 10/each group). ***P < 0.001 versus DSS (–). #P < 0.05, ###P < 0.001 versus DSS (+) + Arbutin (–)
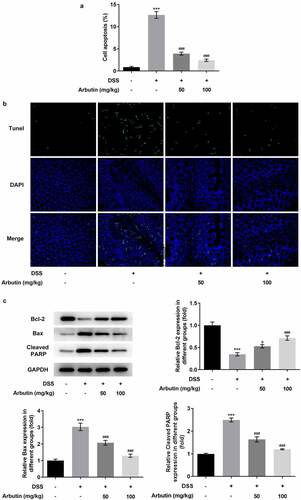
Figure 5. Arbutin increased the expression levels of tight junction proteins and affected MAPK/ELK1. FD4 fluorescence (a), the detection of tight junction proteins through Western blot and RT-qPCR (b, c), the detection of MAPK/ELK1 signals (d). The data were presented in mean ± SD (n = 10/each group). ***P < 0.001 versus DSS (–). #P < 0.05, ##P < 0.01, ###P < 0.001 versus DSS (+) + Arbutin (–)