
Figures & data
Table 1. The different expression genes (DEGs) in BC. DEGs with log FC > 2 and adjust P value < 0.05 were considered as up-regulated genes, and DEGs with log FC < −2 and adjust P value < 0.05 were considered as down-regulated genes
Figure 1. Bioinformatic analysis of the DEGs obtained from GSE42568, GSE45827, and GSE124646 datasets in BC tissues compared to the normal breast tissues. Fold change > 2 and adjust P-value < 0.05 as selection criteria for DEGs. (a) Volcano plot identified the DEGs in three datasets. Red dots stand for up-regulated genes and turquoise dots stand for down-regulated genes. (b) Venn diagram showed the common up-regulated and down-regulated DEGs in three datasets. (c) Heatmap showed the common DEGs in three datasets. Left heatmap indicated the common up-regulated DEGs, and right heatmap indicated the common down-regulated DEGs
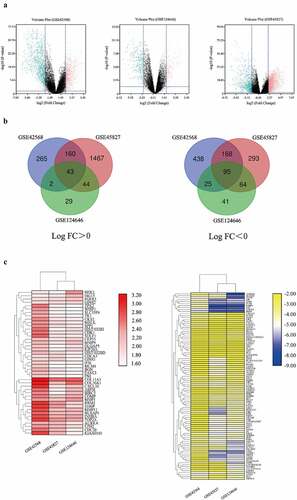
Table 2. Kyoto Encyclopedia of Genes and Genomes (KEGG) pathway analysis in BC
Figure 2. GO enrichment analysis of common DEGs associated with BC. (a) Cellular component. (b) Biological process. (c) Molecular function
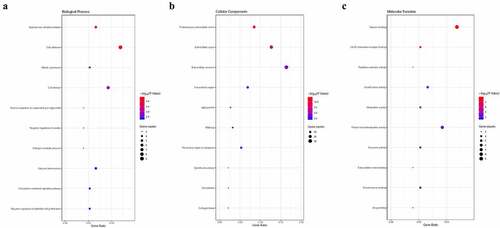
Figure 3. Protein–protein interaction (PPI) network complex and modular analysis of DEGs. (a) The PPI network was structured by STRING online database. (b) Total of 138 DEGs were uploaded into the PPI network complex. (c) The most highly connectivity module was picked up
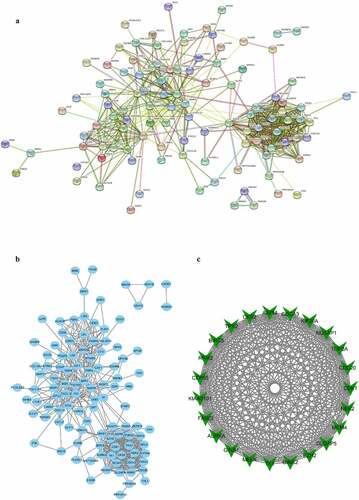
Figure 4. Prognostic value of the 23 hub genes in BC patients based on Kaplan-Meier Plotter. The patients were split into high and low expression groups based on the median gene expression. 23 hubs genes were analyzed for their prognostic value
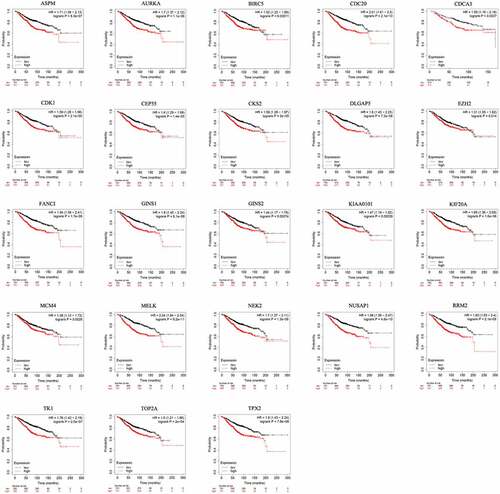
Table 3. Re-analysis of 23 selected genes via KEGG pathway enrichment
Figure 5. Co-expression analysis of CDK1, CDC20, AURKA and MCM4. (a-b) Analysis of the interrelation expression of these four genes in BC was performed by bc-GenExMiner software
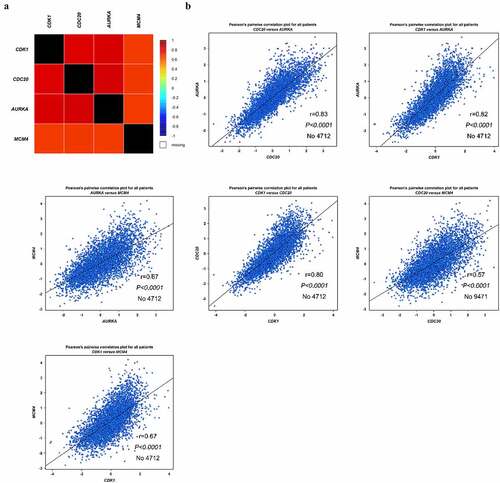
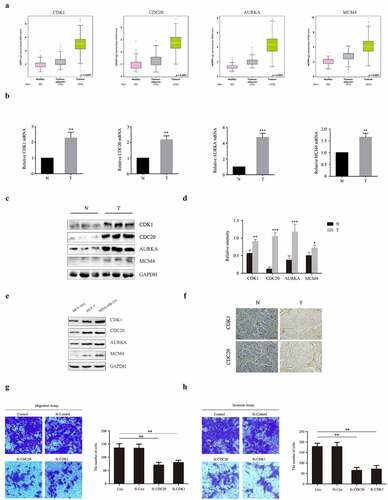
Figure 6. Experimental validation of CDK1, CDC20, AURKA and MCM4 expression both in human BC patients, MCF-10A, MCF-7 and MDA-MB-231 cells. (a) Analysis of mRNA levels of CDK1, CDC20, AURKA and MCM4 in healthy, BC-adjacent and BC tissues in TCGA database. (b) mRNA levels of CDK1, CDC20, AURKA and MCM4 in human samples, performed by RT-PCR. N: normal breast tissues; T: tumor tissues. (c-d) The expression of CDK1, CDC20, AURKA and MCM4 proteins in human samples. The protein fraction was analyzed by Western blot. Relative expression of these proteins was normalized by GAPDH. (e) The expression of CDK1, CDC20, AURKA and MCM4 proteins in MCF-10A, MCF-7 and MDA-MB-231 cells. (f) CDK1 and CDC20 immunohistochemistry staining of breast sections in human samples. (Scale bar = 10 μm). (g-h) MCF-7 were transfected with siRNA against human CDK1 (siCDK1) and CDC20 (siCDC20) or scrambled control siRNA, then incubated for 48 hours. Transwell and invasion assay were used for observing migration and invasion abilities of these cells. The images displayed the migrated and invaded cells into the lower chamber. (Scale bar = 10 μm). Quantified by counting the number of migrated and invaded cells in five randomly fields. *P < 0.05, **P < 0.005, ***P < 0.001, compared with the control group
Supplemental Material
Download MS Word (986.6 KB)Data availability statements
The datasets used and/or analyzed during the current study are available from the corresponding author on reasonable request.