
Figures & data
Figure 1. Methodological evaluation of hsa _circ _0087776. (a) The hsa_circ_0087776 standard curve. (b) The 18s standard curve. (c, d) Stability of hsa_circ_0087776 and 18s in room temperature incubation and repeated freeze-thaw
Table 1. The intra-assay and interassay repeatability difference of hsa_circ_0087776
Figure 2. Methodological evaluation of hsa _circ _0087776. (a) Single peak specificity of hsa _circ _0087776 and 18s dissolution and amplification curves. (b) The specificity of hsa _circ _0087776 and 18s was verified by agarose gel electrophoresis. (c) Sequencing results of hsa _circ _0087776 and 18s
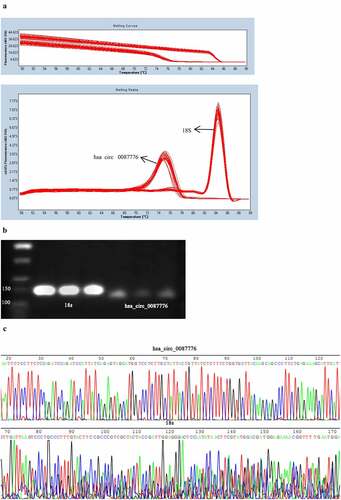
Figure 3. Detection of hsa _circ _0087776 relative expression in serum. (a) Hsa_circ-0087776 and 18s mRNA expression after treatment with RNase R. (b) Differential expression of hsa-circ-0087776 in serum of MM patients. (c) Differential expression of hsa-circ-0087776 in MM cell lines. (*P < 0.05; **P < 0.01; ***P < 0.001)
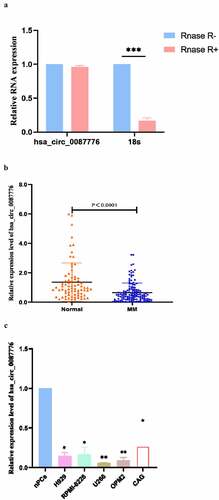
Figure 4. Evaluation of combined diagnostic efficacy of hsa _circ _0087776. (a) The ROC curve of serum hsa _circ _0087776. (b) The ROC curve of ALB. (c) The ROC curve of β2-MG. (d) By contrast, the diagnostic efficacy of serum hsa _circ _0087776 is remarkable
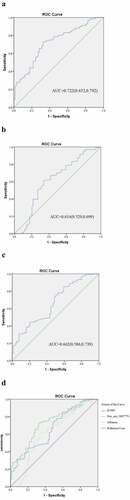
Figure 5. Changes in the expression of hsa_circ_0087776 before and after treatment (P = 0.0111)
Table 2. Use of Hsa_circ_ 0087776, ALB, and β₂-MG levels to distinguish MM patients from healthy participants
Table 3. Correlation between hsa_circ_ 0087776 expression and clinicopathologic features of MM patients
Table 4. Univariate and multivariate analysis of MM-ISS staging and prognostic factors
Data availability statement
The datasets used and/or analyzed during the current study are available from the corresponding author on reasonable request.