Figures & data
Figure 1. Identification of CRC/COVID-19-associated genes. (a) The Venn diagram showed the number of intersecting genes in CRC/COVID-19. (b) Volcano plot showed the expression level of differential expressed CRC/COVID-19-associated genes in CRC. The genes with |log 2 (fold change)| > 1 and -log 10 (FDR) > 1.3 were considered as differential expressed genes
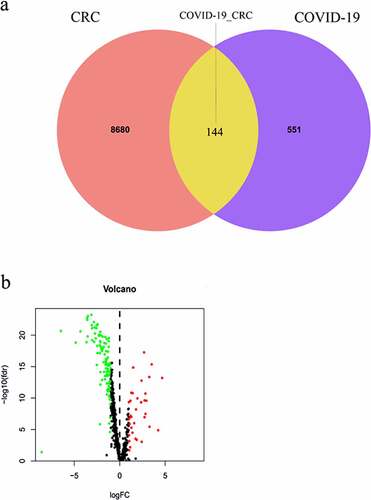
Figure 2. Functional characterization of biochanin A/CRC/COVID-19-associated genes. (a) The Venn diagram showed the number of intersecting genes in biochanin A/CRC/COVID-19. (b) Protein-protein interaction analysis of biochanin A/CRC/COVID-19-interacting genes using STRING tool. (c) Gene ontology enrichment analysis highlighted the biological processes and molecular functions controlled by biochanin A/CRC/COVID-19-associated genes. The size of each dot represents the number of genes. The color intensity of the dot represents the significance of the processes. (d) Circos plot shows the involvement of genes in the enriched biological processes. (e) Kyoto Encyclopedia of Genes and Genomes analysis highlighted the cell signaling pathways mediated by biochanin A/CRC/COVID-19-associated genes. The size of dots represents the number of genes. The color intensity of the dot represents the significance of the pathways. (f) Circos plot showed the involvement of genes in the enriched signaling pathways
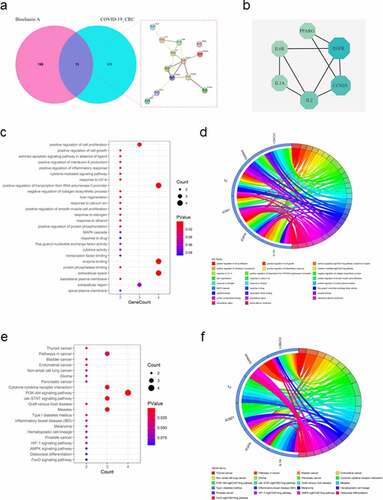
Figure 3. Biological processes and pathways mediated by biochanin A/CRC/COVID-19-associated genes. By using the Cytoscape tool, the biological processes have been highlighted in green and the pathways in purple. The brown shape represents upregulated genes and the yellow shape represents downregulated genes
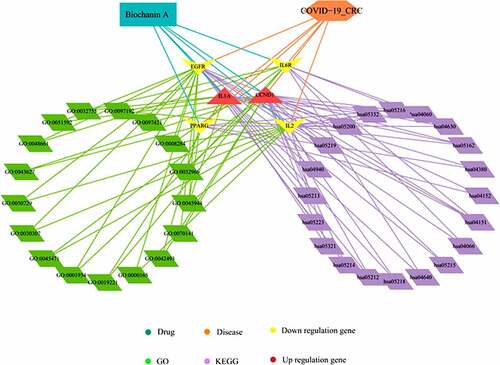
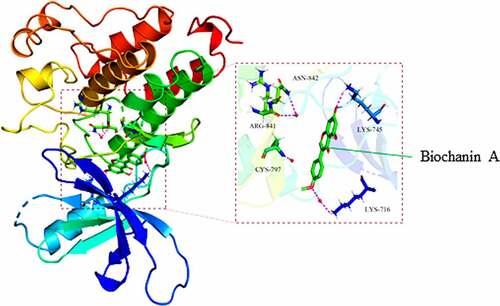
Figure 4. The direct binding of biochanin A to epidermal growth factor receptor (EGFR)