Figures & data
Figure 1. A. Flowchart for FGD1 (FYVE, RhoGEF and PH domain containing 1) selection. Differently expressed genes from GSE3189, GSE15605 and TCGA (The Cancer Genome Atlas) and GTEx (the Genotype-Tissue Expression) datasets were identified, then, 137 intersected genes were included for further study. After Kaplan–Meier analysis, the receiver operating characteristic (ROC) curve, Cox analysis and novelty check in PubMed, FGD1 was selected as target gene; B. The mRNA expression levels of FGD1 in melanoma and normal tissues were detected by real-time quantitative PCR; C. Representative IHC (immunohistochemistry) staining of FGD1 in normal and melanoma tissues (200 × magnification); D. Relative mRNA expression level of FGD1 in Hacat (human immortalized keratinocytes cell line) and 3 melanoma cell lines; E. Correlation between FGD1 expression and patient’s survival; F. ROC analysis of FGD1; G. Forest plot of univariate and multivariate Cox analysis; H. Heatmap of differently expressed genes between FGD1 high-expressed group and low-expressed group. I. Kyoto Encyclopedia of Genes and Genomes (KEGG) pathway enrichment analysis of differently expressed genes
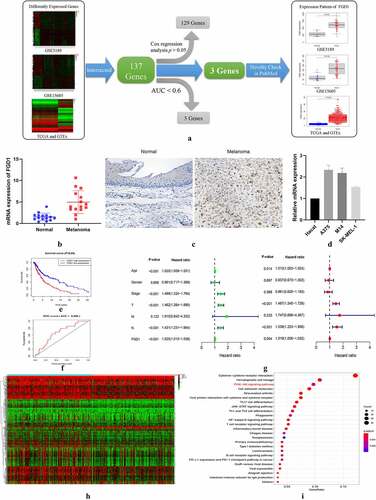
Figure 2. A. shRNA plasma was successfully transfected into cells and green fluorescence can be seen in almost all cells. Magnification is 200× for A375 cells and 200× for M14 cells; B. Relative FGD1 (FYVE, RhoGEF and PH domain containing 1) mRNA expression level was evaluated by qRT-PCR assay; C. Protein level of FGD1 (FYVE, RhoGEF and PH domain containing 1) was evaluated by Western blot. * means P < 0.05
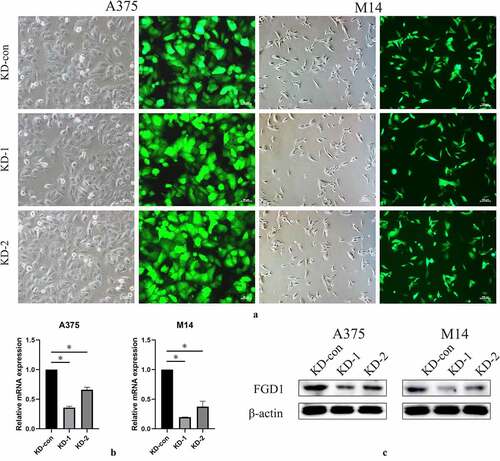
Figure 3. A. Cell migration and invasion were performed in A375 and M14 cells after transfection. The number of migrated or invaded cells was counted by analyzing photographs at 200 × magnification in five random fields per chamber; B. cell counting kit-8 (CCK-8) analysis of knockdown group and control group in 24, 48, 72, 96 hours; C. Relative mRNA expression of apoptosis-related genes, including Bax (BCL2 associated X) and Bcl-2 (BCL2 apoptosis regulator) were detected by qRT-PCR. D. Cell growth was detected by colony formation assay in transfected cells. * means P < 0.05
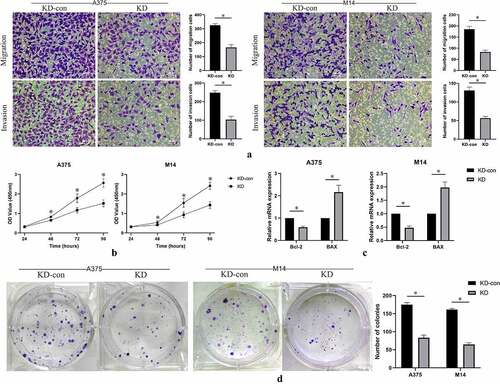
Figure 4. Knockdown FGD1 (FYVE, RhoGEF and PH domain containing 1) might regulated the physiological state of cells via PI3K/AKT signaling pathway. The protein level of key factors in this pathway was detected by Western blot
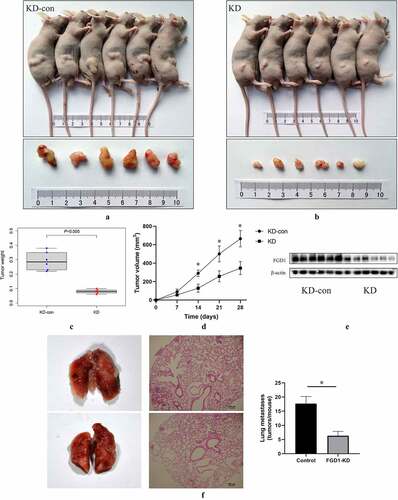
Figure 5. Knockdown FGD1 (FYVE, RhoGEF and PH domain containing 1) inhibited tumor growth in vivo. A, B. Tumors in control group and FGD1 knockdown group were isolated and pictured 4 weeks after injection; C. Tumor weight was calculated in control group and FGD1 knockdown group; D. Tumor volume was calculated in control group and FGD1 knockdown group. E. Protein level of FGD1 was evaluated by western bolt; F. FGD1 knockdown significantly reduced tumor metastasis in A375 melanoma lung metastasis model in vivo. * means P < 0.05