Figures & data
Table 1. GSE103236
Figure 1. NFE2L3 is highly expressed in gastric cancer (a) the expression level of NFE2L3 in GC was increased. (b) Paired sample analysis showed that the expression of NFE2L3 in tumors was still significantly increased. (c) Kaplan-Meier Plotter website predicted that patients with high expression of NFE2L3 had poorer survival time. (d) Immunohistochemical results showed that the expression of NFE2L3 in tumor tissues was higher than that in adjacent tissues. (e) Immunofluorescence showed the localization of NFE2L3 in GC cells, mainly concentrated in the cytoplasm. (f) Western blot assay showed that the expression of NFE2L3 in tumor was significantly higher than that in paracancerous tissues. (g) the expression of NFE2L3 in GC cell lines was higher than that in normal gastric mucosal cell lines
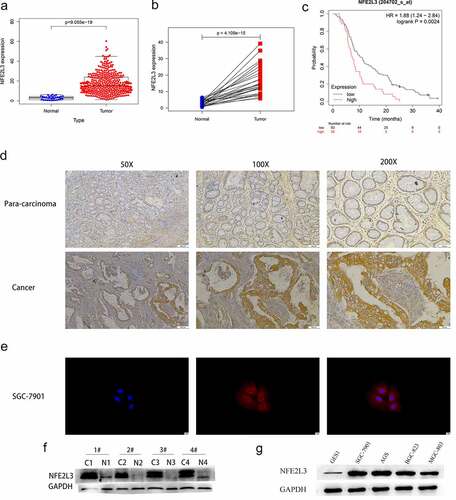
Figure 2. Silencing NFE2L3 inhibited cell proliferation and metastasis (a) Western blot and RT-qPCR were used to detect the protein expression and mRNA changes of NFE2L3 in GC cells after lentivirus gene knockout. (b) CCK-8 assay was used to detect the proliferation of SGC-7901 and MGC803 cells at 24, 48, 72, 96 and 120 h after NFE2L3 knockdown. (c) In colony formation assays, NFE2L3 knockdown significantly reduced the colony numbers. (d, e) The migration and invasion ability of the cells silenced by NFE2L3 were significantly decreased (***p < 0:001; **p < 0:01; *p < 0:05)
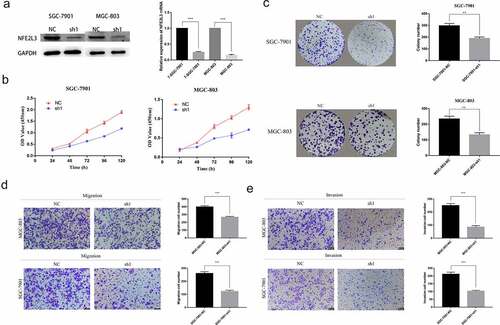
Figure 3. Knockdown of NFE2L3 arrested cell cycle induced apoptosis and was associated with EMT (a, c) Flow cytometry was used to detect the changes of cell cycle, and histogram was used to quantify the distribution of cell cycle changes in G1, G2 and S phase. (b, d) Flow cytometry was used to detect the changes of apoptosis, and a column chart was used to show the changes in the proportion of apoptosis. (e, g) Western blot was used to detect the expression of key proteins regulating apoptosis and cycle. (f, i) to detect the expression changes of key proteins during the development of EMT. (h) The changes of the ratio of Bcl-2/BAX protein reflected the changes of apoptosis (***p < 0:001; **p < 0:01; *p < 0:05)
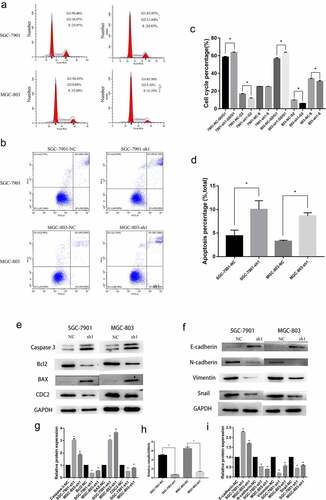
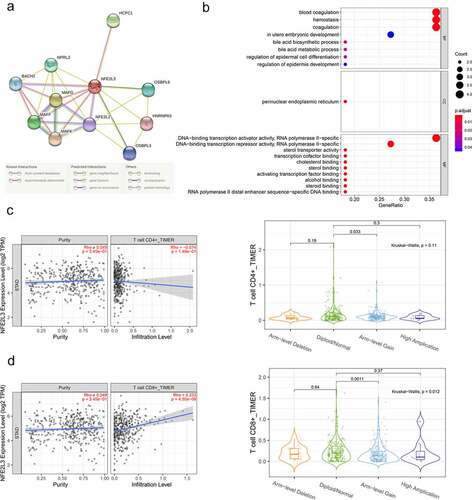
Figure 4. Establishment of Protein-Protein Interaction (PPI) Network and GO functional enrichment analysis (a) The genes related to NFE2L3 were predicted using the STRING website and plotted the PPI network. The lines with different colors indicated different prediction relationships, and the specific relationships were explained below the figure. (b) Use NFE2L3 and related genes to draw the enrichment analysis diagram of GO function. The size of the circle represents the level of correlation, the color change means the size of P value. (c,d) Firstly, the scattered plot of tumor purity on the left is used for correction, and the correlation analysis between NFE2L3 and CD4 + T cells and CD8 + T cells is carried out. The vertical axis is the expression of NFE2L3, the horizontal axis is the infiltration level of T cells, and the upper right is the correlation coefficient and P value. The violin diagram shows the difference in T cell expression with different copy number of NFE2L3 gene, P < 0.05 indicates a statistical difference