
Figures & data
Figure 1. The flow chart of this study
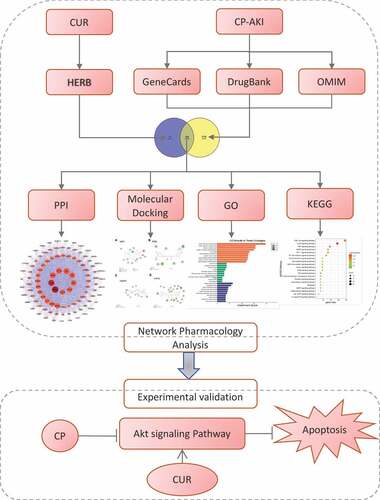
Figure 2. The pharmacological properties of CUR and PPI network analysis of shared targets from CUR and CP-AKI. (a) 2D structure of curcumin (CUR) and the corresponding pharmacological properties. (b) The Venn diagram acquired an intersection between CUR and CP-AKI. The purple area indicates targets for CUR, the yellow zone indicates targets for CP-AKI, and the overlap zone indicates the common targets. (c) PPI network of CUR against CP-AKI. Nodes represent targets protein; edges indicate interaction of targets. The larger the node and the deeper the color, the higher the degree. (d) The top 10 core targets ranked by degree-value. (e) PPI network analysis of core targets
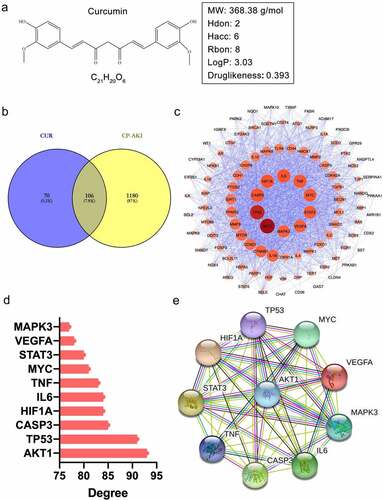
Figure 3. Docking analysis between CUR and the top four core targets: AKT1, TP53, CASP3, and HIF1A (ranked by degree-value) (a–d). The deep green dashed lines indicate hydrogen bonds, light pink dashed lines suggest pi-alkyl, deep pink dashed lines represent pi-pi stack, and brown dashed lines indicate pi-Anion interactions. The light green nodes represented the Vander Waals interactions. The dark red nodes indicate unfavorable donor-donor
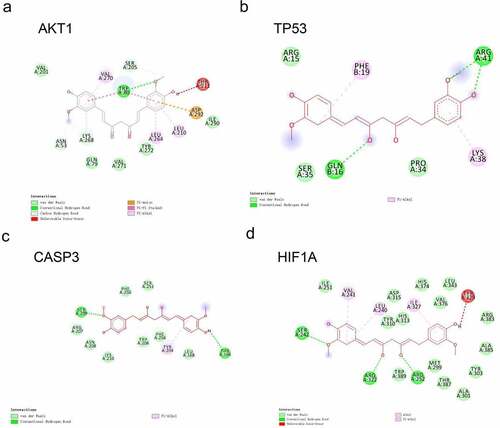
Table 1. Molecular docking of the top four core targets by degree with CUR
Figure 4. GO enrichment analysis and KEGG pathway enrichment analysis of CUR against CP-AKI. (a) The biological process (BP), cell composition (CC), and molecular function (MF) of GO enrichment analysis were represented by brown columns, green columns, and blue columns, respectively. The X-axis represents the enrichment score, and the Y-axis indicates the category of GO. (b) The top 20 KEGG pathways are presented in the bubble chart. The X-axis shows the gene ratio, the color represents the p-value, and bubble size represents the count of targets enriched in terms. (c) The PPI network of targets involved in the PI3K-Akt signaling pathway
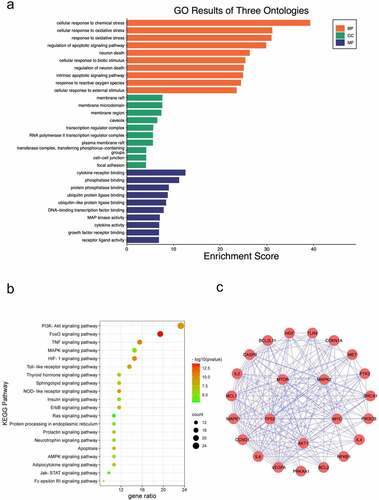
Table 2. Top 20 terms of KEGG pathways enriched in CUR against CP-AKI
Figure 5. (a) KEGG pathway-target network diagram of CUR against CP-AKI. Red ellipse nodes represent enriched KEGG pathways, purple rectangle nodes indicate the targets, and the green diamond node indicates CUR. (b) Schematic drawing of the PI3K-Akt signaling pathway. The red font labels show the targets of CUR against CP-AKI involved in the PI3K-Akt signaling pathway
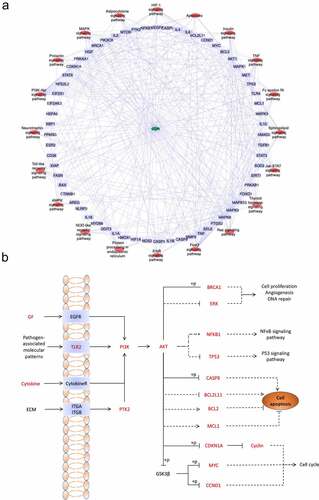
Figure 6. CUR inhibited CP-induced HK-2 cells apoptosis. (a) The cell viability of HK-2 cells exposed to different concentrations of CUR for 24 h was detected using CCK-8 analysis. Data are means ± SD (n = 7). * vs 0 μM: *p < 0.05. (b) Cell viability was evaluated by CCK-8 in HK-2 cells stimulated with CUR and CP for 24 h. Data are means ± SD (n = 7). *vs CON group: *p < 0.05; #vs CP group: #p < 0.05. (c) Protein levels of Bcl2, Bax, and cleaved caspase-3 (Cle-casp3) were measured by Western blots in HK-2 cells treated with CP or CUR for 24 h, and quantitatively analyzed. (d) Cell apoptosis was detected by flow cytometry in HK-2 cells after being treated with CP and CUR. Data are means ± SD (n = 3). HK-2 cells treated with 0.1% DMSO solvent served as CON group. *vs CON group: *p < 0.05, **p < 0.01; #vs CP group: #p < 0.05
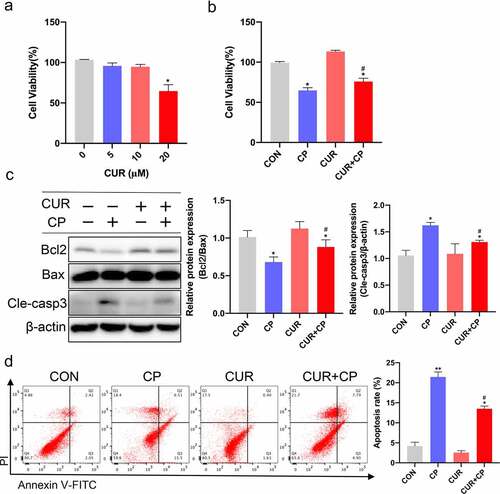
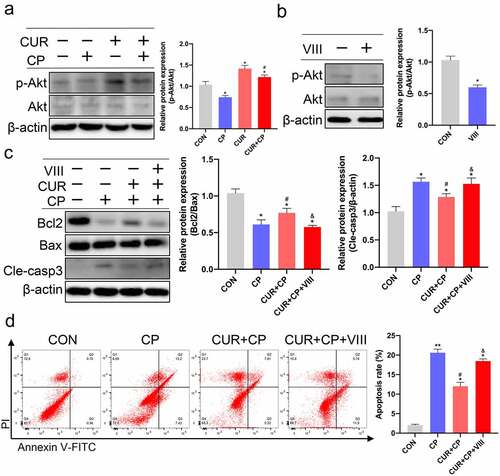
Figure 7. CUR exerts anti-apoptosis effects via the Akt signaling pathway in HK-2 cells. (a) The protein levels of phosphorylated Akt (p-Akt, Ser473) and total Akt (Akt)were measured by Western blotting in HK-2 cells treated with CP and CUR, and quantitatively analyzed. (b) Western blots detected p-Akt and Akt in HK-2 cells stimulated with VIII, and quantitatively analyzed. (c) Western blots evaluated protein expression of Bcl2, Bax, and cleaved caspase-3 in HK-2 cells stimulated with CP, CUR, and VIII, then quantitatively analyzed. (d) Apoptosis was analyzed by flow cytometry in HK-2 cells incubated with CP, CUR, and VIII. Data are means ± SD (n = 3). HK-2 cells treated with 0.1% DMSO solvent served as CON. *vs CON group: *p < 0.05, **p < 0.01; #vs CP group: #p < 0.05; &vs CUR+CP group: &p < 0.05
Data availability statement
The data used to support the findings of this study are included within the article.