Figures & data
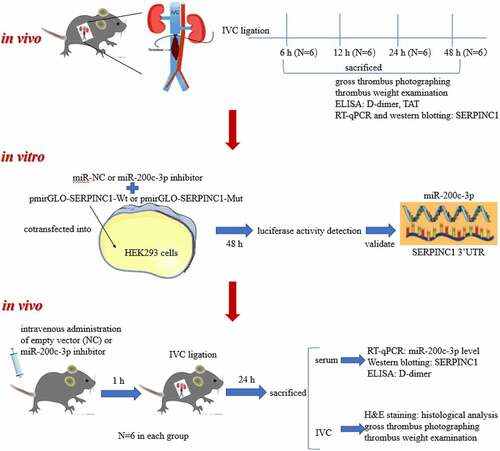
Table 1. Clinical data of the study population
Table 2. Primer sequences used for RT-qPCR
Figure 1. SERPINC1 is downregulated in serum of VTE rats
(a) Representative images for gross IVC with thrombus obtained from rats at indicated time point (6 h, 12 h, 24 h, and 48 h post IVC ligation). (b) Thrombus weight, (c) D-dimer serum level and (d) TAT serum level from control and thrombotic rats at indicated time points. n = 6. (e-f) SERPINC1 mRNA level and protein level in control or thrombotic group at indicated time points was examined using RT-qPCR and western blotting, respectively. n = 6. (g) Scatter plot analysis of the correlation between SERPINC1 level and thrombus weight of rats in the thrombotic group. n = 24. *p < 0.05, **p < 0.01, ***p < 0.001.
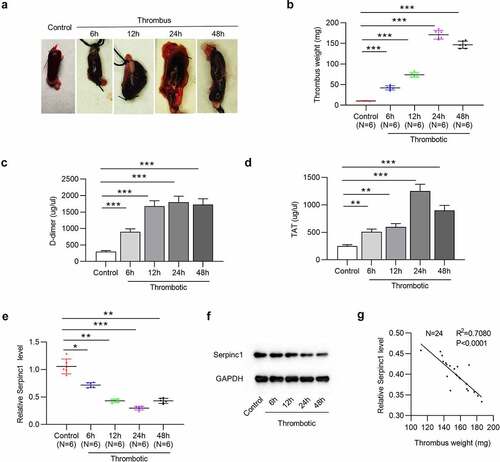
Figure 2. SERPINC1 is targeted by miR-200c-3p
(a) TargetScan database predicted five miRNAs potentially harboring conserved binding sites for SERPINC 3ʹUTR. (b) Candidate miRNA expression levels were tested using RT-qPCR in control or thrombotic group. n = 6. (c) Binding sequence of miR-200 c-3p on SERPINC1 3ʹUTR is obtained from TargetScan database. (d) Luciferase reporter assay was conducted to assess the binding ability of miR-200 c-3p and SERPINC1 3ʹUTR. **p < 0.01. miR-NC: miRNA inhibitor negative control; Wt: wild-type; Mut: mutant.
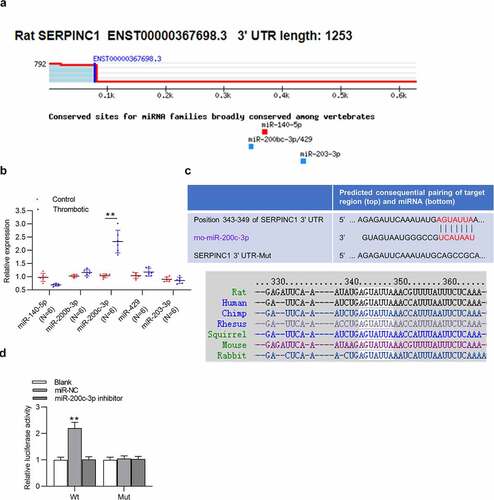
Figure 3. MiR-200c-3p downregulation suppresses the thrombus formation in VTE rat models
(a) Representative photomicrographs of H&E-stained sections of thrombus with the vessel wall. (b) Representative images of gross IVC with thrombus. (c) Thrombus weight and (d) D-dimer serum level in the thrombotic group administered with miR-200 c-3p inhibitor versus the thrombotic group. n = 6. *p < 0.05, **p < 0.01, ***p < 0.001. NC: miRNA inhibitor negative control.
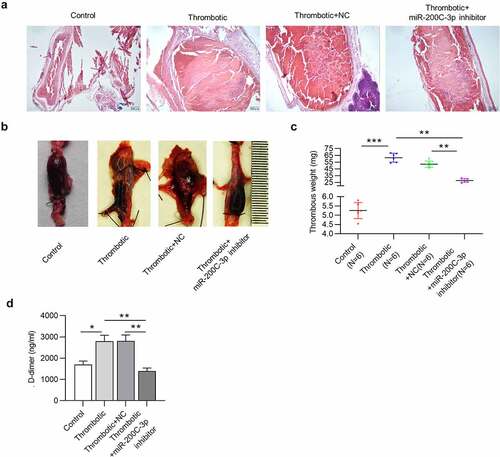
Figure 4. MiR-200c-3p negatively regulates SERPINC1 in VTE rat models
(a) MiR-200 c-3p level in rat serum in control, thrombotic, thrombotic + NC, thrombotic + miR-200 c-3p inhibitor groups. n = 6. (b) SERPINC1 protein level in rat serum in each group. (c) Scatter plot analysis of the correlation between SERPINC1 protein level and miR-200 c-3p level in thrombotic rat serum. n = 18. (d) MiR-200 c-3p level in rat IVC in control, thrombotic, thrombotic + NC, thrombotic + miR-200 c-3p inhibitor groups. n = 6. (e) SERPINC1 protein level in IVC of rats in each group. (f) Scatter plot analysis of the correlation between SERPINC1 protein level and miR-200 c-3p expression in IVC of thrombotic rats. n = 18. **p < 0.01, ***p < 0.001. NC: miRNA inhibitor negative control.
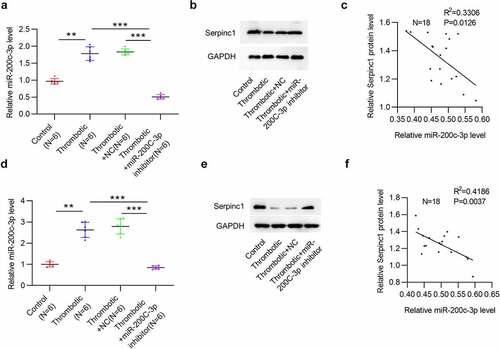
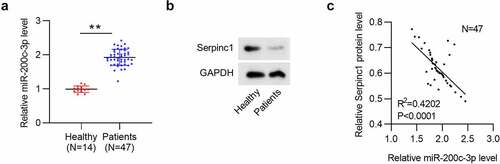
Figure 5. SERPINC1 expression is negatively related to miR-200c-3p level in plasma of VTE patients
(a) Circulatory miR-200 c-3p level and (b) SERPINC1 protein level in plasma of VTE patients (n = 47) and control subjects (n = 14). (c) Scatter plot analysis of the correlation between SERPINC1 protein level and miR-200 c-3p expression in plasma of VTE patients. n = 47. **p < 0.01.Graphic abstract: miR-200 c-3p targets SERPINC, the gene for antithrombin, to reduce SERPINC1 translation, ultimately alleviating the aggravation of VTE.