Figures & data
Figure 1. LncRNA ANCR expressions in breast cancer tissues (n = 48) and cells (n = 3). **Compared with MCF10A cells, p < 0.001; #compared with paracancerous tissue, p < 0.05
Figure 2. LncRNA ANCR expressions in cells after transfection. All experiments were performed in triplicate independently. *Compared with MDA-MB-231 (MCF-7)-shANCR cells, p < 0.05
Table 1. Correlations between lncRNA ANCR expression and clinicopathological characteristics of patients with breast cancer
Figure 3. Effect of lncRNA ANCR on MDA-MB-231 (MCF-7) cell proliferation. All experiments were performed in triplicate independently. A: MTT assay results; B: colony formation assay results
Figure 4. Effect of lncRNA ANCR on MDA-MB-231 (MCF-7) cell invasion. All experiments were performed in triplicate independently. Compared with MDA-MB-231-shANCR cells, *p < 0.05
Figure 5. Effect of lncRNA ANCR on MDA-MB-231 (MCF-7) cell migration. All experiments were performed in triplicate independently. Compared with MDA-MB-231-shANCR cells, *p < 0.05
Figure 6. Effect of lncRNA ANCR on tumor formation in nude mice (n = 8). A: Tumor volumes; B: tumor weights. Compared with MDA-MB-231-shANCR group, *p < 0.05
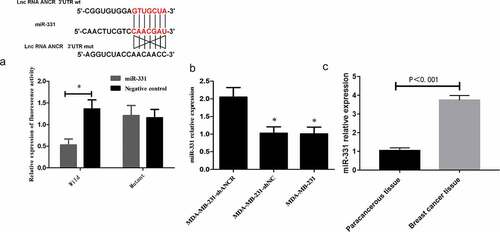
Figure 7. Relationship between lncRNA ANCR and miR-331. A: Dual luciferase reporter assay results; B: RT-PCR results. Compared with MDA-MB-231-shANCR group, *p < 0.05; C: miR-331 expressions in breast cancer and adjacent tissues (n = 48). All experiments were performed in triplicate independently