
Figures & data
Table 1. Sequences used for qRT-PCR
Figure 1. SNHG18 expression in glioma and its biological function in regulating cell proliferation.
(a) Online database GEPIA (matched TCGA normal data) was employed to analyze SNHG18 expression in GBM tissues (red column, n = 163) and normal tissues (gray column, n = 207).(b) qRT-PCR was applied to detect SNHG18 expression in 47 pairs of glioma tissues and adjacent tissues.(c) GEPIA was employed to conduct a Kaplan-Meier analysis of the overall survival time of glioma patients with high (red line, n = 109) and low (blue line, n = 54) SNHG18 expression levels.(d) qRT-PCR was conducted to detect SNHG18 expression in glioma cell lines (U251, U87, LN229, LN308 and T98G cells) and human astrocytes (NHA cells).E. si-SNHG18#1 and si-SNHG18#2 were transfected into U251 and T98G cells, and the transfection efficiency was detected by qRT-PCR.(f–g) After the transfection, CCK-8 experiment (F) and EdU experiment (G) were used to detect U251 and T98G cells viability and proliferation.*P < 0.05, **P < 0.01 and ***P < 0.001.
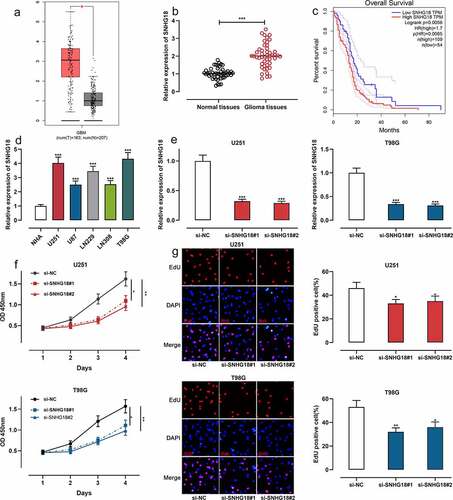
Table 2. Relationship between clinicopathological features and expression of SNHG18 in glioma
Figure 2. Knockdown of SNHG18 inhibits the migration and invasion of glioma.
(a) After si-SNHG18#1 and si-SNHG18#2 were transfected into U251 cells, Transwell experiment was applied to detect the migration and invasion of U251 cells.(b) After si-SNHG18#1 and si-SNHG18#2 were transfected into T98G cells, Transwell experiment was applied to detect the migration and invasion of T98G cells.(c) After si-SNHG18#1 and si-SNHG18#2 were transfected into U251 and T98G cells, Western blot was performed to detect the expressions of E-cadherin, N-cadherin and Vimentin.**P < 0.01 and ***P < 0.001.
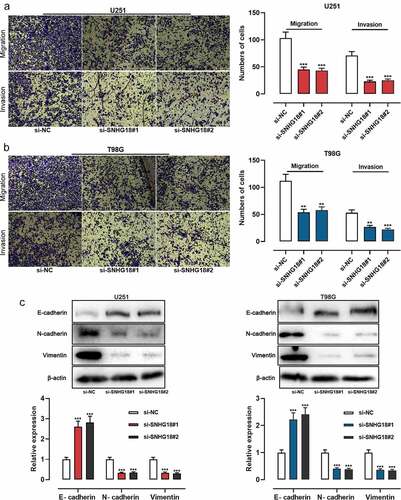
Figure 3. SNHG18 specifically regulates miR-338-5p expression.
(a) Subcellular localization of SNHG18 in U251 and T98G cells was assessed by qRT-PCR after nuclear–cytoplasm fractionation.(b) qRT-PCR was conducted to detect miR-338-5p expression in glioma cell lines and NHA cells.(c) MiR-338-5p mimics and inhibitors were transfected into U251 and T98G cells, respectively, and the transfection efficiency was examined by qRT-PCR.(d) The schematic map of the SNHG18-WT and SNHG18-MUT binding sites for miR-338-5p.(e) SNHG18-WT or SNHG18-MUT was co-transfected into U251 cells with miR-338-5p or mimics NC, and the relative luciferase activity was measured.(f) RIP assay was performed, and the enrichment of SNHG18 and miR-338-5p in the immunoprecipitate was measured.(g) qRT-PCR was adopted to detect the regulatory effect of SNHG18 knockdown on miR-338-5p expression in U251 and T98G cells.(h) qRT-PCR was applied to detect miR-338-5p expression in 47 pairs of glioma tissues and adjacent tissues.(i) The correlation between SNHG18 and miR-338-5p expressions in glioma tissues was analyzed by Pearson’s correlation analysis.*P < 0.05, **P < 0.01 and ***P < 0.001.
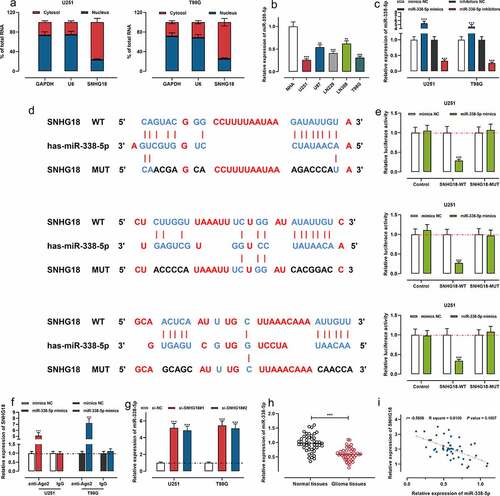
Figure 4. MiR-338-5p inhibitors can reverse the effects of SNHG18 knockdown on the proliferation, migration, and invasion of U251 and T98G cells.
(a) si-SNHG18#1 and miR-338-5p inhibitors were co-transfected into U251 and T98G cells, respectively. qRT-PCR was used to detect transfection efficiency.(b–d) The proliferation, migration, and invasion of glioma cells after co-transfection with si-SNHG18#1 + miR-338-5p inhibitors were detected by CCK-8 assay (B), EdU experiment (C) and Transwell experiment (D), respectively.(e) Western blot was conducted to detect the expressions of E-cadherin, N-cadherin and Vimentin in glioma cells after co-transfection with si-SNHG18#1 +miR-338-5p inhibitors.*P < 0.05, **P < 0.01 and ***P < 0.001.
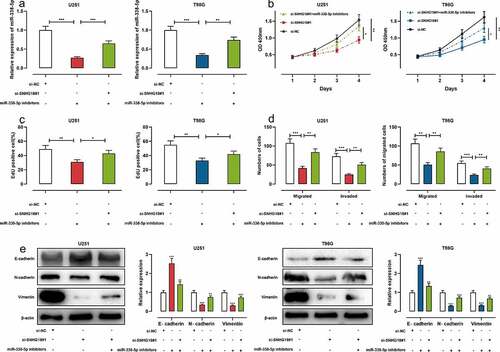
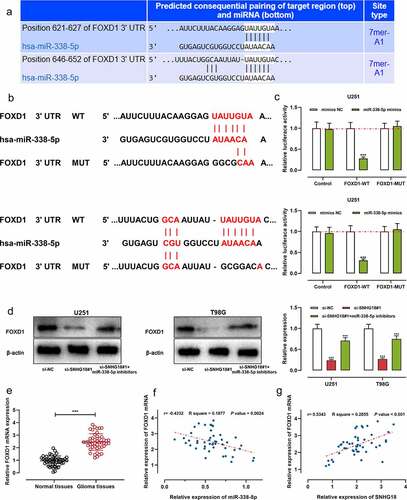
Figure 5. SNHG18 knockdown can inhibit FOXD1 expression.
(a,b) The schematic map of FOXD1 3ʹUTR WT and FOXD1 3ʹUTR MUT binding site for miR-338-5p.(c) FOXD1-WT or FOXD1-MUT was co-transfected into U251 cells with miR-338-5p mimics or mimics NC, and the relative luciferase activity was measured.(d) si-SNHG18#1 and miR-338-5p inhibitors were co-transfected into U251 and T98G cells, respectively. Western blot was used to detect FOXD1 protein expression.(e) qRT-PCR was applied to detect FOXD1 mRNA expression in 47 pairs of glioma tissues and adjacent tissues.(f–g) The correlations between FOXD1 and miR-338-5p, and FOXD1 and SNHG18 in glioma tissues, were analyzed by Pearson’s correlation analysis.***P < 0.001.
Supplemental material
Supplemental Material
Download Zip (17.9 MB)Data Availability Statement
The data used to support the findings of this study are available from the corresponding author upon request.