Figures & data
Figure 1. The human DBL family and DOCK family of Rho GEFs. (a) The 70 members of DBL family Rho GEFs and (b) 11 members of DOCK family Rho GEFs are arranged in phylogenetic tree by MEGA7.0 software, using the protein sequences obtained from UniProt. The protein domain architecture is visualized by Evolview. Each color represents one distinct structural domain. The DH, PH domains of DBL Rho GEF family and DHR-1, DHR2 domains of DOCK Rho GEF family with the corresponding colors are highlighted in the left panel. All proteins are visualized in the same scale except OBSCN. For other structural domains, please refer to FigureS1. DH: Dbl homology; PH: Pleckstrin homology; DHR-1: DOCK homology region 1; DHR-2: DOCK homology region
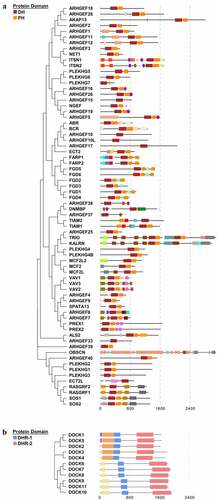
Figure 2. Expression of Rho GEFs in NSCLC. The expression levels of Rho GEFs in NSCLC, represented by LUSC and LUAD, are analyzed by GEPIA database. (a) The median expression of Rho GEFs in LUAD compared to normal tissues. (b) The median expression of Rho GEFs in LUAD compared to normal tissues. The transcripts per million (TPM) of genes are normalized by log10(TPM). Gene name with red (higher expression compared to normal tissue) and green (lower expression compared to normal tissue) color indicates P < 0.05 for their expressions in tumors compared to normal tissues
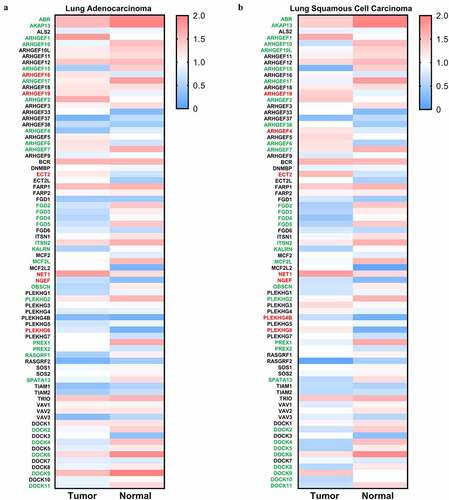
Figure 3. Expression of ABR, PREX1, DOCK2 and DOCK4 in NSCLC. (a) The body map of various organs (GEPIA), the cohort of Garber Lung (Oncomine), and the LUSC and LUAD patient specimens with normal tissues for the expression of ABR (GEPIA) are illustrated. (b) The body map (GEPIA), the cohorts of Hou Lung and Okayama Lung (Oncomine), and the LUSC and LUAD patient samples with normal tissues for PREX1 expression (GEPIA) are demonstrated. (c) The body map including different organs (GEPIA), the cohorts of Bhattacharjee Lung and Selamat Lung (Oncomine), and the LUSC and LUAD patient samples with normal tissues for DOCK2 expression (GEPIA) are shown. (d) The body map (GEPIA), the cohorts of Bhattacharjee Lung, Hou Lung, Wachi Lung, Landi Lung, Su Lung and Stearman Lung (Oncomine), and the LUSC and LUAD patient samples with normal tissues for DOCK4 expression (GEPIA) are illustrated. Red: tumor tissue. Green: normal tissue. The deeper color in the body map represents higher expression.*P < 0.05
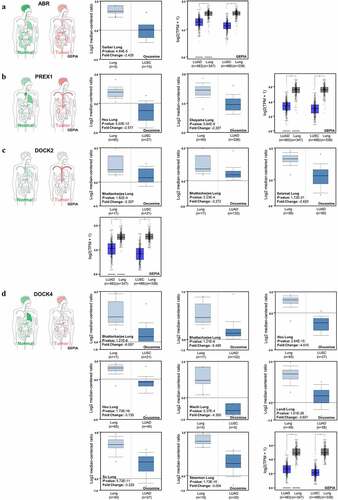
Figure 4. Prognostic value of ABR, PREX1, DOCK2 and DOCK4 expression in NSCLC. (A, C, E, G) Survival curves referring to OS are plotted for LUAD and LUSC patients. (B, D, F, H) Survival curves with regard to FP are generated for patients with LUAD and LUSC. Log-rank P values and HRs with 95% CIs are displayed. FP: first progression; HR: hazard ratio; OS: overall survival
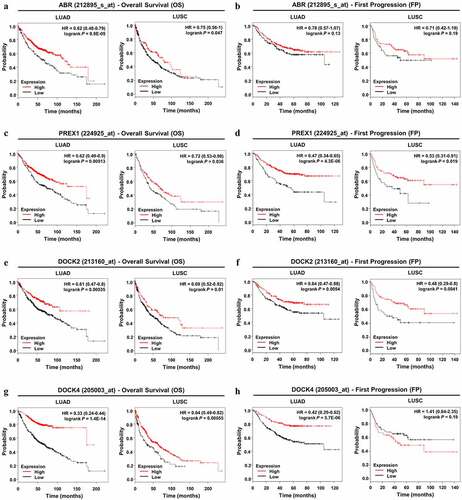
Figure 5. Impact of DNA methylation on ABR, PREX1, DOCK2 and DOCK4 expression in NSCLC. Visualization of TCGA data for the promoter region methylation and mRNA expression of (a) ABR, (b) PREX1, (c) DOCK2 and (d) DOCK4 in LUAD and LUSC, compared to those in normal tissues using MEXPRESS. The correlation of (e) ABR, (f) PREX1, (g) DOCK2 and (h) DOCK4 expression with promoter methylation is analyzed by cBioPortal database. Spearman’s correlation analysis and Pearson’s correlation analysis are performed in the database. The regression line is used to illustrate the correlation trend
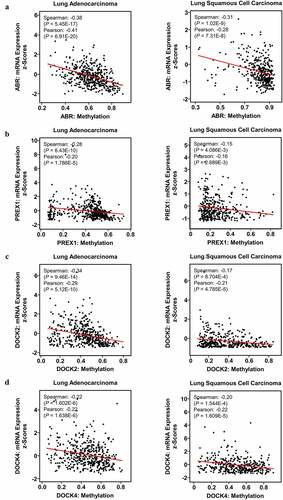
Figure 6. GSEA analysis between the high-expression group and low-expression group in ABR, PREX1, DOCK2 and DOCK4 for NSCLC. The correlation between the enrichment of MYC signaling gene set and (a) ABR, (c) PREX1, (e) DOCK2 and (g) DOCK4 expression in LUAD and LUSC. The association between the expression of (b) ABR, (d) PREX1, (f) DOCK2 and (h) DOCK4 expression with DNA repair gene set enrichment. The barcode plot demonstrates gene positions in each gene set. The horizontal bar indicates positive (red) and negative correlation (blue) with gene expression. FDR: false discovery rate
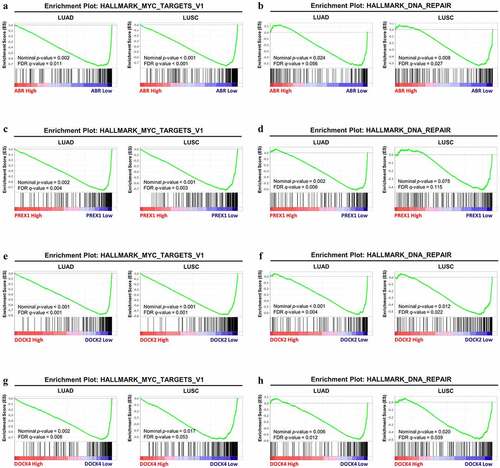
Table 1. Gene Set Enrichment Analysis (GSEA) of gene sets significantly enriched in LUAD and LUSC
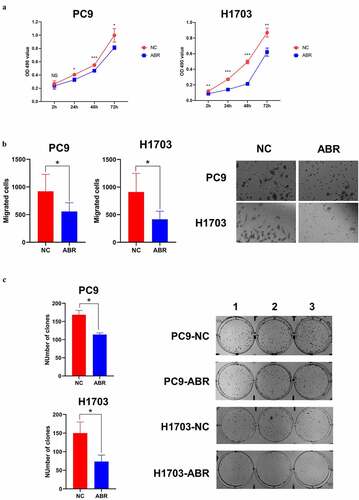
Figure 7. ABR shows tumor suppression effect in proliferation, migration and cloning ability in PC9 and H1703 cells. The cell proliferation experiment of PC9 and H1703 cell lines with overexpression of ABR (a). The migration capacity of PC9 and H1703 cells under ABR overexpression is shown, and the right panel illustrates tumor cells that invaded the chamber (b). The cloning formation ability of PC9 and H1703 cells under ABR overexpression, and the right panel demonstrates the colonies formed in each well (c). NC: control group with transfection by empty vector. ABR: ABR overexpressed group. NS: non-significant, * P < 0.05, ** P < 0.01, *** P < 0.001