Figures & data
Table 1. Relationship between the ITGA11 expression in GC tissue samples and clinical characteristics
Table 2. Primer sequences
Figure 1. Expression of ITGA11 in GC
A: The ITGA11 profile in cancerous and paracancerous normal tissues of 49 clinical samples was examined by qRT-PCR. B: The ITGA11 profile in five cases of cancerous and paracancerous GC tissues was verified by WB. C: The GEPIA database was adopted to verify ITGA11 expression in GC tissue. D: The effect of ITGA11 on the GC prognosis was analyzed in the human protein altas (https://www.proteinatlas.org/). E. Kaplan-Meier Plotter database (http://kmplot.com/analysis/) was adopted for analyzing the association of ITGA11 levels with overall survival, first progression and post progression survival of GC sufferers. **P < 0.01, ***P < 0.001
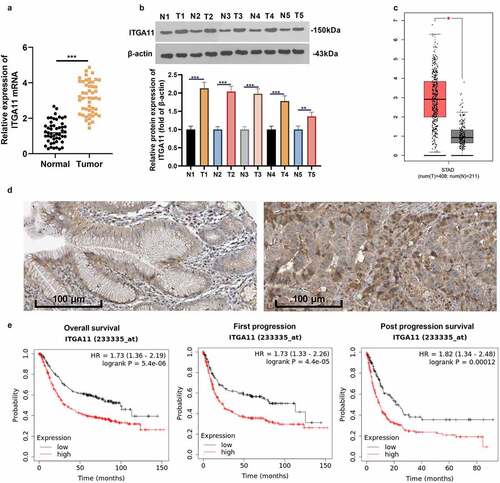
Figure 2. Inhibiting ITGA11 attenuated GC cell proliferation and invasion and strengthened apoptosis
ITGA11 knockdown models were constructed in MKN45 and AGS cells. A-B: qRT-PCR and WB were implemented to test the effect of ITGA11 knockdown plasmids. C-D: Cell proliferation was verified by CCK-8 and colony formation experiment. E-F: The migrative and invasive ability of MKN45 and AGS were monitored by Transwell assay. G: The profiles of Bcl-2, Bad, C-Caspase3 and Bax were monitored by WB. H: TUNEL assay was adopted to gauge the apoptosis of MKN45 and AGS cells. Ns P > 0.05, *P < 0.05, **P < 0.01, ***P < 0.001. N = 3
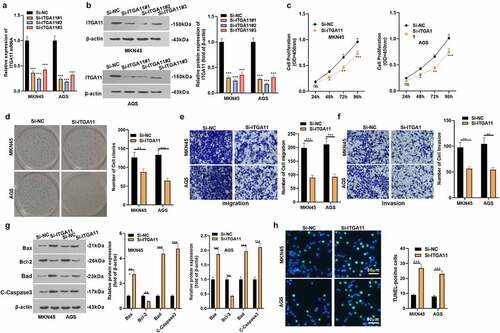
Figure 3. The regulatory effect of ITGA11 on the ITGA11/ PI3K/AKT pathway
LinkedOmics database (http://linkedomics.org/login.php) was used for analyzing the potential downstream targets of ITGA11. A: The positively and negatively co-expressed Top-50 genes of ITGA11 in GC were displayed in heat maps. B: The overall closely co-expressed genes of ITGA11 in GC were exhibited as a volcano plot. C-D: PI3K-AKT pathway has a potential role in ITGA11 in GC. The data was analyzed by GSEA. E-I: The LinkedOmics database analyzed the correlation between ITGA11 and PIK3CG, PIK3CD, PIK3CA, AKT2, and AKT3
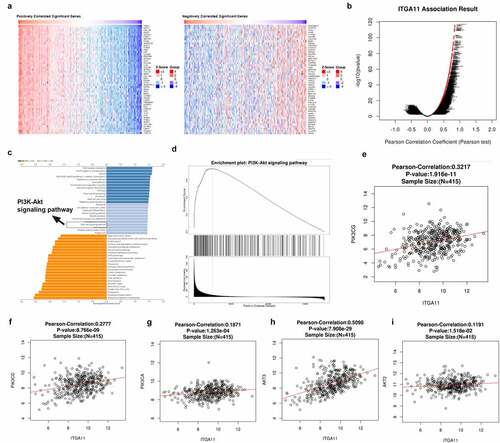
Figure 4. Inhibiting ITGA11 inactivated PI3K/AKT
ITGA11 knockdown models were established in MKN45 and AGS. A-B. WB was applied to make certain the PI3K/AKT profile in MKN45 and AGS cells. * * * P < 0.001, N = 3
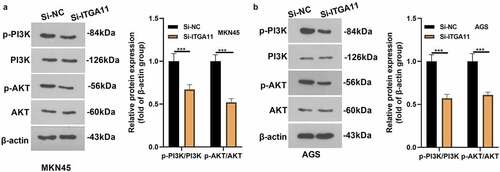
Figure 5. Activating PI3K repressed the effect of ITGA11 knockdown on GC progression
ITGA11 knockdown plasmids and/or IGF-1 were added to MKN45 cells. A-B: The CCK-8 assay and colony formation test were carried out to gauge cell proliferation. C-D: Cell migration and invasion were assessed by Transwell assay. E: The profiles of Bcl-2 and Bax were monitored by WB. F: WB gauged the protein levels of the PI3K/AKT axis in MKN45 cells. * P < 0.05, * * P < 0.01, * * * P < 0.001, N = 3
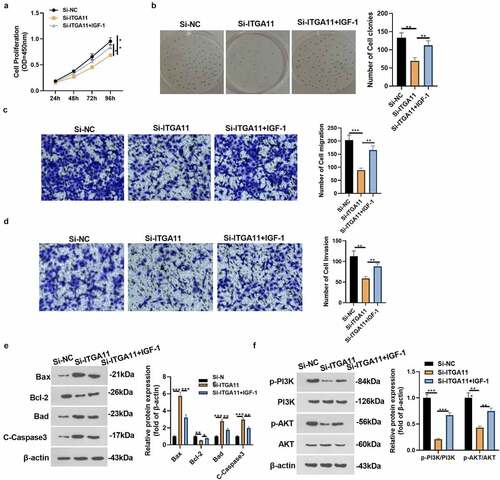
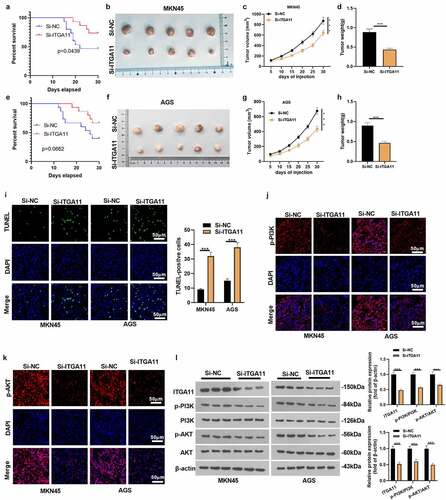
Figure 6. Knocking down ITGA11 dampened GC cell growth cells in vivo.
Mouse tumor models knocking down ITGA11 were constructed in MKN45 and AGS cell lines. A: Analysis of survival rates in mice. B-G: After 30 days, the nude mice were sacrificed, and their subcutaneous nodules were removed, with tumor volume and weight calculated. H: The TUNEL assay was employed to examine apoptosis in tumor tissues. I: The fluorescence intensity of the PI3K/AKT pathway was checked by tissue immunofluorescence. J: The profiles of ITGA11 and PI3K/AKT were tested by WB. * * * P < 0.001, N = 5