Figures & data
Table 1. Composition and characterization of nanoparticles
Figure 1. Effect of nanoparticle sizes on the pharmacokinetics. (a) Concentration of nanoparticles with different size in the mice serum after the injection within 48 hours. (b)The terminal half-time (T1/2), (c) area under the serum concentration–time curve (AUC(0–48 h)) and (d) clearance (CLZ) as pharmacokinetics parameters were analyzed. Data were mean ± s.d. from n = 3 independent experiments
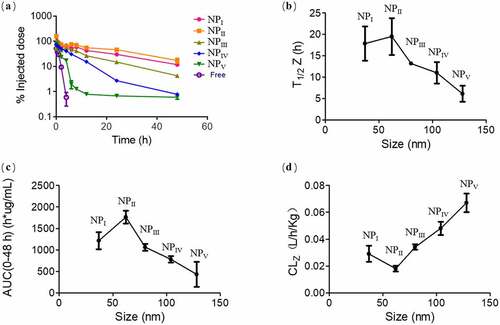
Figure 2. Distribution of nanoparticles with different sizes in liver (a), spleen (b) and kidney (c). Accumulation of various nanoparticles in tumors. (n = 3, data were means ± s.d.) *p < 0.05, **p < 0.01, ***p < 0.001
Figure 3. Distribution of nanoparticles with the size of 37 nm in the main tissues. All the samples were analyzed with panoramic microscope of TissueGnostics Gmbh (TissueFAXS PLUS)
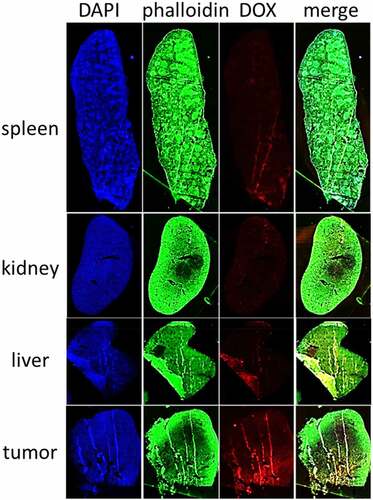
Figure 4. Anti-tumor activity of nanoparticles loaded with DOX. (a) Inhibition effect of DOX-loaded nanoparticles on tumor volume growth. (b) Image of tumors removed from the mice at the end of treatment. (c) The weight of tumors. (d) The changes of mice body weight during the treatment. Here was the statement that two mice were dead due to individual differences during the treatment, which were removed from the final statistics. (n = 5, data were means ± s.d.). *p < 0.05, **p < 0.01, ***p < 0.001
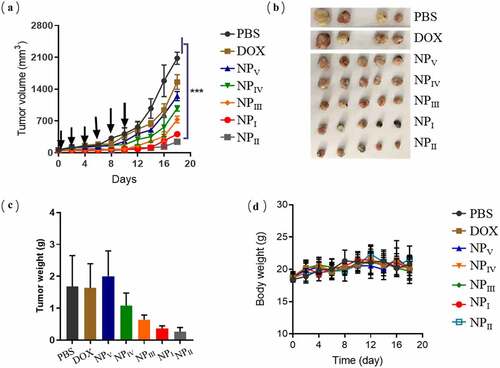
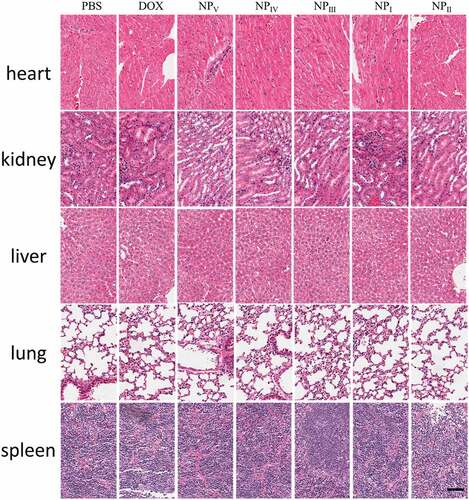
Figure 5. Pathological examination of main tissues. After 18 days of treatment, the tissues were collected for safe evaluation. Scale bar represent 200 μm