Figures & data
Figure 1. Diagram of the test process (arrows with different colors and different line types referred to different test processes)
Figure 2. Observation of macrophage RAW264.7 oil red O staining (×100)
Figure 3. Macrophage RAW264.7 proliferation detection (* indicated that the difference between groups was statistically significant, P < 0.05)
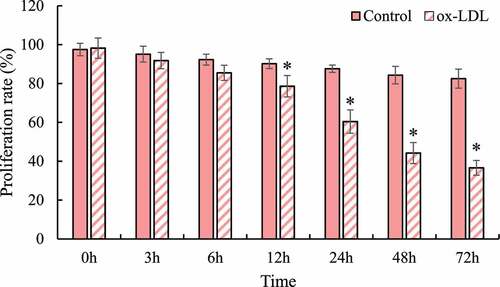
Figure 4. Macrophage RAW264.7 apoptosis detection (* indicated that the difference between groups was statistically significant, P < 0.05)
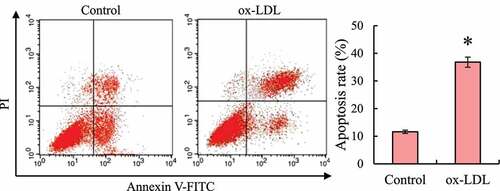
Figure 5. Detection of Caspase-3 and GRP78 protein expression levels in macrophages RAW264.7 (* indicated that the difference between groups was statistically significant, P < 0.05)
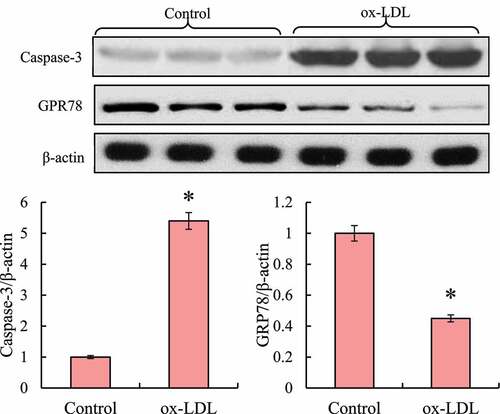
Figure 6. Detection of PDGFR-β mRNA and protein expression levels in macrophages RAW264.7 (* indicated that the difference between groups was statistically significant, P < 0.05)
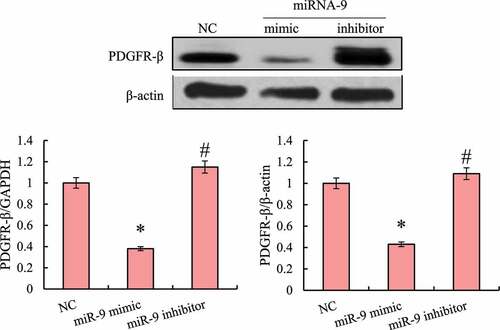
Figure 7. Target prediction results of miRNA-9 and multi-species PDGFR-β 3ʹ UTR region (red bases were the target binding sites)
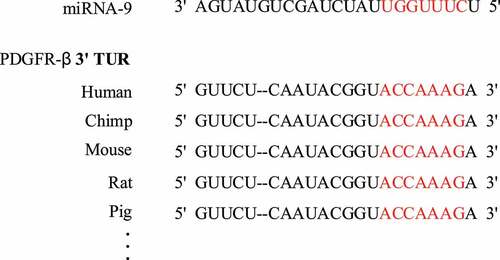
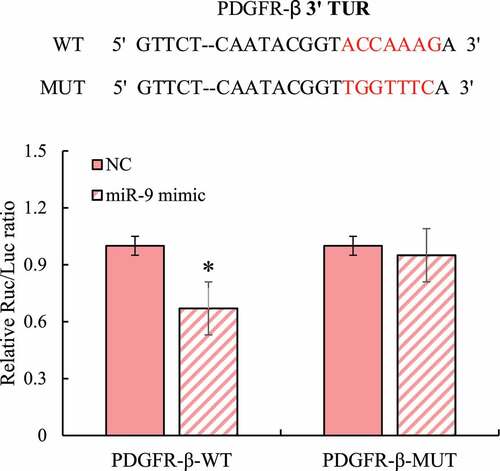
Figure 8. Results of dual luciferase reporter gene detection (red bases were wild-type and mutant-type binding sites; and * indicated that the difference between groups was statistically significant, P < 0.05)