Figures & data
Figure 1. The typical inflammatory cytokines (IL-6, IL-1β, TNF-α) in serum of GFP-labeled E.coli induced bacterial peritonitis rat models were detected by ELISA kits at 0, 6, 12, 24, and 48 h (n = 10 rats per group). a: The concentration of IL-1β in serum; b: The concentration of IL-6 in serum; c: The concentration of TNF-α in serum. Experimental values are expressed as mean ± S.E.M. *P < 0.05, **P < 0.01, and ***P < 0.001 compared with time 0.
Figure 2. Characterization of exosomes isolated from the serum in bacterial peritonitis rat models; a: Transmission electron microscopy (TEM) characterization of the morphology exosomes (scale bar: 500 nm); b: Nanoparticle tracking analysis (NTA) to quantify the size and concentration of exosomes (n = 3); c: Western blot analysis of protein CD63 enriched in exosomes.
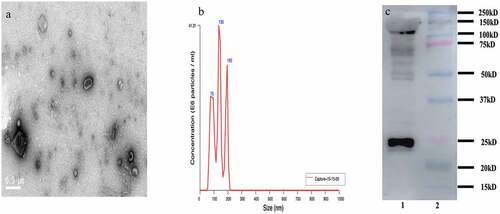
Figure 3. Changes of HIF-1α concentration in exosomes during 72 h after bacterial peritonitis induced by GFP-labeled E.coli. Experimental values are expressed as mean ± S.E.M *p < 0.05; **p < 0.01 and ***p < 0.001 compared with time 0 (n = 10 rats per group).
Figure 4. Whole-body imaging of GFP-labeled E.coli in bacterial peritonitis rat model. a: Representative images of injection 12 and 24 h after E.coli-GFP infection; b: Representative images of mice treated with ICS (20 mg/kg) at time points of 12 and 24 h after GFP-labeled E.coli infection. Animal survived. The fluorescence and bright field images are overlay. The right coordinate represents the fluorescence intensity.
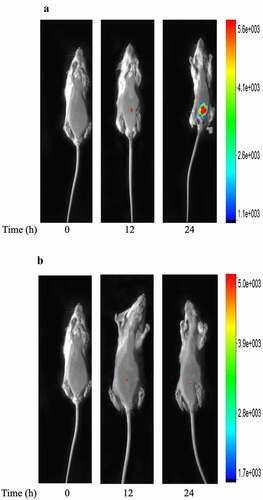
Figure 5. The effect of ICS on expression of serum exosomal HIF-1α in bacterial peritonitis model. Experimental values are expressed as mean ± S.E.M (n = 10 rats per group). **P < 0.01, and ***P < 0.001 compared with time 0. ##P < 0.01 and ###P < 0.001 versus model group at the corresponding time point (n = 10 rats per group).
Figure 6. The effect of ICS treatment on the level of (IL-6 and IL-1β) in the serum with bacterial peritonitis model. a: The concentration of IL-6 in serum; b: The concentration of IL-1β in serum; Experimental values are expressed as mean ± S.E.M (n = 10 rats per group). *P < 0.05, **P < 0.01, and ***P < 0.001 compared with time 0. #P < 0.05, ##P < 0.01, and ###P < 0.001 versus model group at the corresponding time point.