Figures & data
Figure 1. The relationship between AHR and its associations and gene set enrichment analysis in cervical cancer based on the LinkedOmics database. Map of AHR-related genes(a). Heat map of the top 50 genes positively (b) and negatively (c) correlated with AHR. Gene set enrichment analysis of AHR (d)
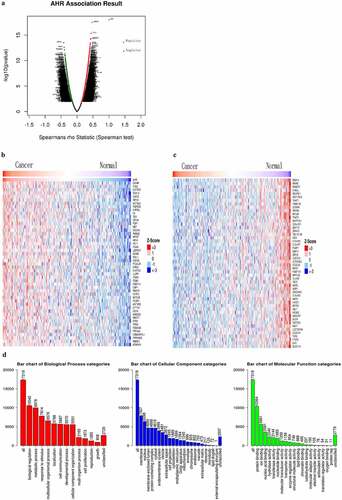
Figure 2. Interactions between AHR and related proteins
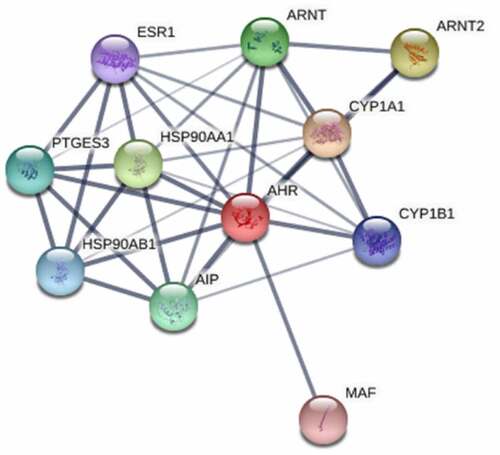
Figure 3. Expression of AHR in GEO cervical cancer datasets. Expression of AHR in GSE7410(a), GSE67522(b)and GSE6791(c)
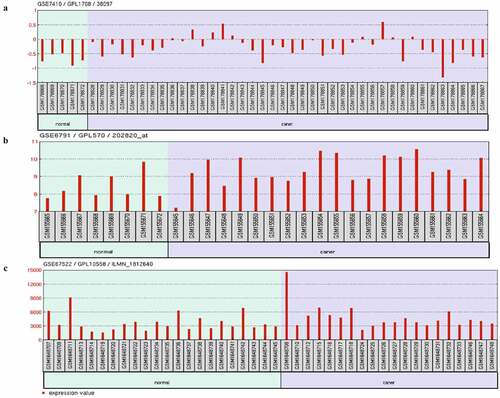
Table 1. The interaction scores of AHR with its related proteins
Table 2. The expression of AHR and related genes in GEO data sets
Figure 4. The expression of AHR and related genes was correlated with immune infiltration level in cervical cancer based on TIMER database. AHR(a), CYP1A1(b), ARNT2(c), HSP90AA1(d), ARNT(e), AIP(f), PTGES3(g), HSP90AB1(h), CYP1B1(i), ESR1(j)and MAF(k) with cervical cancer associated tumor sample purity, B cells, CD8 + T cells, CD4 + T cells, macrophages, neutrophils, and dendritic cells
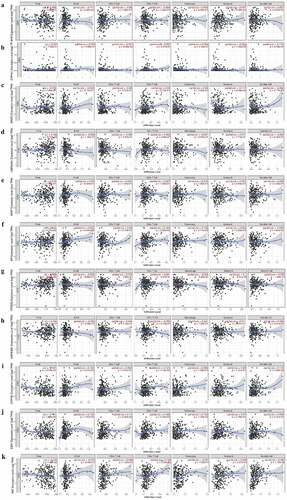
Figure 5. Correlations between AHR and related genes and immuno regulators in cervical cancer based on TISIDB database. The correlations between the expression of AHR, CYP1A1, HSP90AA1, PTGES3, CYP1B1, ESR1, and MAF and immunoinhibitors (a), immunostimulator (b), and MHC molecules (c) were calculated based on TISIDB database
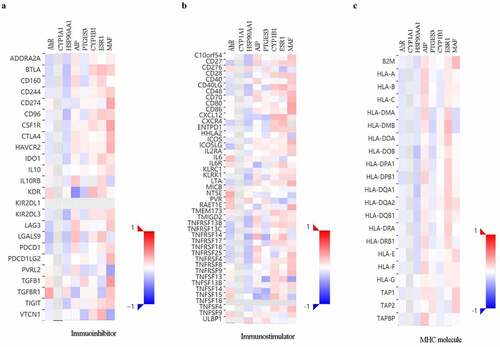
Table 3. Multivariate Cox regression analysis
Figure 6. Alterations of AHR(a), CYP1A1(b), ARNT2(c), HSP90AA1(d), ARNT(e), AIP(f), PTGES3(g), HSP90AB1(h), CYP1B1(i), ESR1(j), MAF(k) were correlated with prognosis in cervical cancer patients based on the Kaplan-Meier database
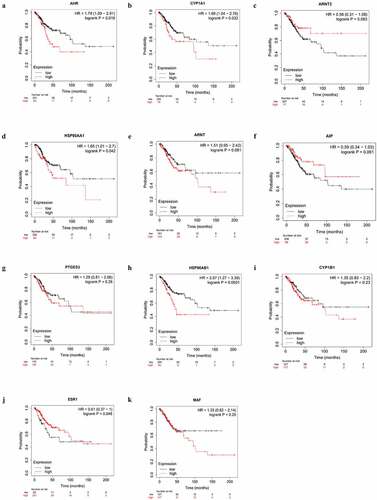
Figure 7. Nomogram of factors associated with survival time in cervical cancer patients
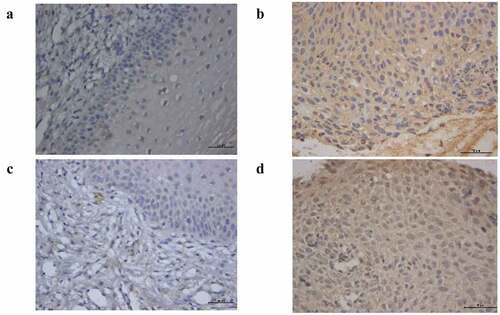
Table 4. The positive expression of AHR and CYP1A1 in cervical tissue
Figure 8. The expression of AHR in normal (a), cancer (b). The expression of CYP1A1 in normal (c), cancer (d)