Figures & data
Figure 1. Src inhibitor reduces LPS-induced the activation of BV2 microglia. (a) Cell viability of BV2 microglia after 5, 10, 20, 50, 100 and 200 µM PP2 treatment for 24 h. (b) The Western blotting of p-Src and Src in LPS-stimulated microglia after 5 or 50 µM PP2 treatment for 24 h. (c) The analysis of the p-Src/Src ratio. (d) The IF images of p-Src in control, LPS, LPS+PP2 (5 µM) and LPS+PP2 (50 µM) group; amplification: 400 × . (e) The IF images of IBA-1 in control, LPS, LPS+PP2 (5 µM) and LPS+PP2 (50 µM) group; amplification: 400×; Scale bar = 100 μm. ‘*’ means p < 0.05 vs. the control group, ‘#’ means p < 0.05 vs. the LPS+vehicle group
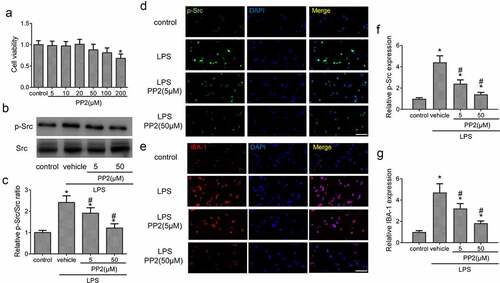
Figure 2. Src inhibition inhibits microglia-driven inflammation via blocking NF-κB activity. (a) The double IF staining including COX-2 and iNOS in LPS-stimulated microglia after 5 or 50 µM PP2 treatment for 24 h, amplification: 400×; Scale bar = 100 μm. (b) The representative images of microglial trans-well assay after LPS stimuli with PP2 treatment or not; Scale bar = 100 μm. The mRNA levels of TNF-α (c) and IL-6 (d) in LPS-stimulated microglia after 5 or 50 µM PP2 treatment for 12 h. (e) The Western blotting assay of NF-κB in microglial nucleus after LPS stimuli with PP2 treatment or not. ‘*’ means p < 0.05 vs. the control group, ‘#’ means p < 0.05 vs. the LPS+vehicle group
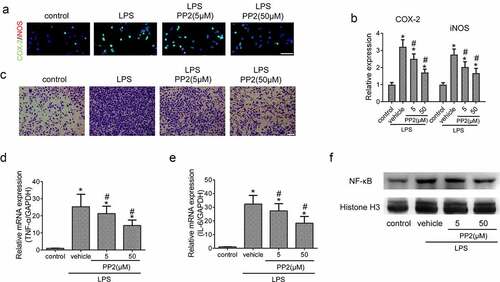
Figure 3. Confirmation of the efficiency of Src inhibitor PP2 in PNL-treated mice. (a) The program flowchart of NP model experiments in vivo. (b) The protein expression of p-Src and Src in the spinal cords of PNL-treated mice at 21 days post injury. (c) The analysis of the p-Src/Src ratio. (d) The quantitation of Src protein. (e) The IHC staining of p-Src in SDH of PNL-treated mice at 21 days post injury; amplification: 400×; Scale bar = 100 μm. (f) The quantitation of Src positive area. ‘*’ means p < 0.05 vs. the sham group, ‘#’ means p < 0.05 vs. the PNL group
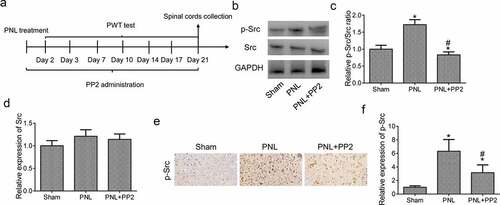
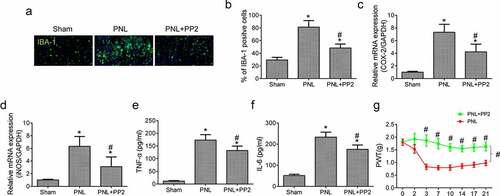
Figure 4. Src inhibition reduces neuroinflammation and improves allodynia after PNL. (a) The IF staining of IBA-1 in SDH of PNL-treated mice at 21 days post injury; amplification: 400×; Scale bar = 100 μm. (b) The quantitation of IBA-1 positive cells. The mRNA levels of COX-2 (c) and iNOS (d) in the spinal cords of PNL mice at 21 days post injury. The ELISA assay of TNF-α (e) and IL-6 (f) in the spinal cords of PNL mice at 21 days post injury. (g) The PWT assay of mice at 2, 3, 7, 10, 14, 17, 21 days post PNL. ‘*’ means p < 0.05 vs. the sham group, ‘#’ means p < 0.05 vs. the PNL group