Figures & data
Figure 1. NEAT1 is elevated in medulloblastoma and leads to cisplatin resistance. (a) Expressions of NEAT1 were detected in MB tumor (n = 40) and adjacent non-tumor specimen (n = 40) by q-RT-PCR. (b) NEAT1 was silenced in DAOY and D341 cells by NEAT1 siRNA transfection. (c, d) Cell proliferation assays were performed in DAOY and D341 cells with control siRNA or NEAT1 siRNA in 0, 24, 48 and 72 hours. (e, f) The above transfected cells were exposed to cisplatin at the indicated concentrations for forty-eight hours, cells viability was examined by MTT assay and (g, h) Annexin V apoptosis assay. *, p < 0.05; **, p < 0.01; *** p < 0.001.
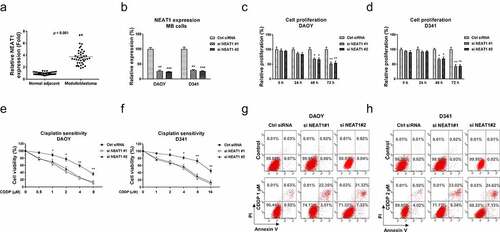
Figure 2. Associations of NEAT1 and glutamine metabolism with cisplatin resistance in MB cells. (a) DAOY parental and cisplatin resistant cells were treated with cisplatin at 0, 1, 2, 4, 8 or 16 µM for forty-eight hours, cell responses to cisplatin were examined by MTT assay. (b) DAOY parental and Cis Res cells were exposed to cisplatin, survival cells were detected by clonogenic assay. (c) Expressions of NEAT1 in DAOY parental and Cis Res cells were determined by qRT-PCR. (d) Glutamine uptake and (e) Glutaminase activity were determined in DAOY parental and cisplatin resistant cells. (f) DAOY Cis Res cells were growth under normal or low glutamine condition, cells were then exposed to cisplatin for 48 hours. Clonogenic assay was performed. *, p < 0.05; **, p < 0.01; ***, p < 0.001.
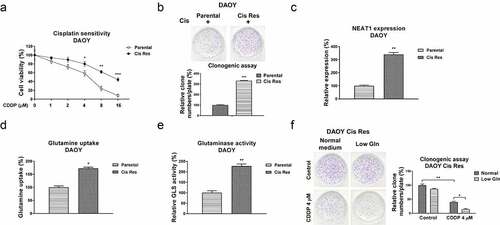
Figure 3. NEAT1 sponges miR-23a-3p and negatively regulates its expression. (a) The NEAT1 and miR-23a-3p interactions was predicted from starBase.com. (b) Expressions of NEAT1 and miR-23a-3p in MB tissues were analyzed by Pearson’ correlation coefficient analysis. (c) DAOY, D341 and UW228 cells were transfected with control vector or NEAT1 overexpression vector. miR-23a-3p expressions were examined by qRT-PCR. (d) DAOY and (e) D341 cells were subjected to biotin-labeled RNA pull-down assay. Amount of miR-23a-3p was determined by qRT-PCR. (f) Dual-luciferase vector with insertion of WT- or Mut- NEAT1 was co-transfected with miR-23a-3p or control miRNA into DAOY and (g) D341 cells. Luciferase activities were determined. *, p < 0.05; **, p < 0.01; ***, p < 0.001.
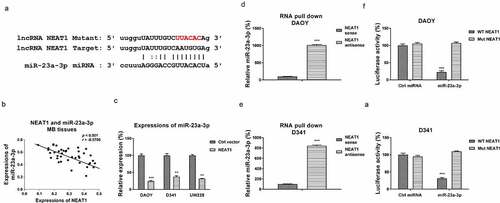
Figure 4. miR-23a-3p is suppressed in medulloblastoma and sensitizes MB cells to cisplatin. (a) miR-23a-3p expression levels were detected in MB tumor (n = 40) and adjacent non-tumor specimen (n = 40) by q-RT-PCR. (b) DAOY, D341 and UW228 cells were transfected with control miRNA or miR-23a-3p precursor for 48 hours, glutamine uptake was determined. (c) DAOY, (d) D341 and (e) UW228 cells were transfected with miR-23a-3p or control miRNAs, cell growth rates at 0, 24, 48 and 72 hours were determined by MTT assay. (F, G, H) The above transfected cells were exposed to cisplatin at the indicated concentrations for forty-eight hours, cells viability was examined by MTT assay. *, p < 0.05; **, p < 0.01; *** p < 0.001.
Figure 5. miR-23a-3p directly targets the 3ʹUTR of GLS cells. (a) Bioinformatics analysis of potential miR-23a-3p binding sites on 3ʹUTR of GLS. (b) GLS mRNA expression levels were detected in MB tumor (n = 40) and adjacent non-tumor specimen (n = 40) by q-RT-PCR. (c) Expressions of GLS and miR-23a-3p in MB tissues was analyzed by Pearson’ correlation coefficient analysis. (d) DAOY and D341 cells were transfected with control miRNA or miR-23a-3p precursor. GLS protein expressions were determined by Western blot. (e) A dual-luciferase reporter plasmid containing WT-GLS or Mut-GLS was co-transfected into DAOY and (f) D341 cells with miR-23a-3p or control miRNAs. Luciferase activities were determined. (g) Glutaminase activities were detected in MB cells without or with miR-23a-3p overexpression. (h) DAOY cisplatin resistant cells were transfected with control siRNA or two GLS siRNAs. Cells were exposed to cisplatin at the indicated concentrations. Cell viability in response to cisplatin was examined by MTT assay and (i) Annexin V apoptosis assay. *, p < 0.05; **, p < 0.01; ***, p < 0.001.
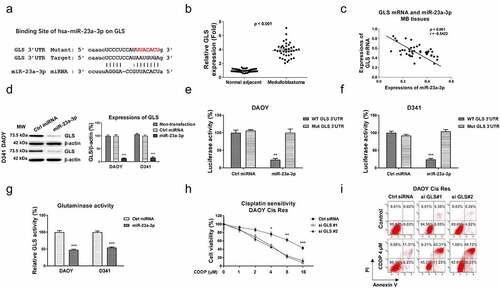
Figure 6. miR-23a-3p sensitizes MB cells to cisplatin via targeting GLS. (a) Control, miR-23a-3p or miR-23a-3p plus GLS overexpression vector was transfected into DAOY Cis Res cells. the GLS protein expressions were determined by Western blot. (b, c) The transfected DAOY Cis Res cells were exposed to cisplatin at variant cisplatin concentrations Cell viability in response to cisplatin was determined by MTT assay Annexin V apoptosis assay. *, p < 0.05; **, p < 0.01; ***, p < 0.001.
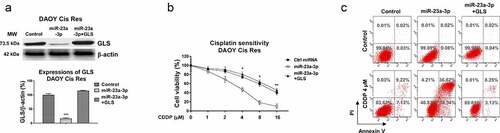
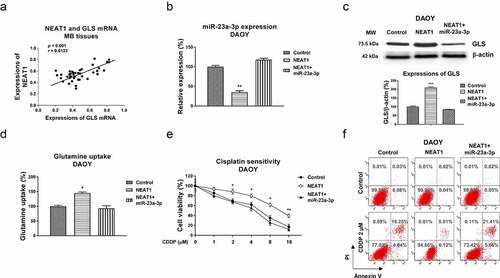
Figure 7. The NEAT1-miR-23a-3p-GLS axis in cisplatin resistance of MB cells. (a) Expressions of NEAT1 and GLS in MB tissues were analyzed by Pearson’ correlation coefficient analysis. (b) DAOY Cis Res cells were transfected with control, NEAT1 or NEAT1 plus miR-23a-3p, expressions of miR-23a-3p were determined by qRT-PCR and (c) Western blot. (d) Glutamine uptake was measured in the above transfected MB cells. (e) Control vector, NEAT1 or NEAT1 plus miR-23a-3p was transfected into DAOY Cis Res cells, which were treated with cisplatin at the indicated concentrations, cell viability and (f) apoptosis were examined by MTT and Annexin V assay, respectively. *, p < 0.05; **, p < 0.01; ***, p < 0.001.