Figures & data
Figure 1. Body weight test results of rats in each group (a: compared with the control group, P < 0.05; b: compared with LV-SC group, P < 0.05)
Figure 2. Detection results of paw thickness of rats in different groups before and after modeling (A. 1 day before modeling; B. 4 days after modeling; C. 8 days after modeling; D. 16 days after modeling; (* meant P < 0.05 compared with the control group; # suggested P < 0.05 compared with LV-SC group)
Figure 3. Test results of MWT (* meant P < 0.05 compared with the control group; # suggested P < 0.05 compared with LV-SC group)
Figure 4. Test results of TWL (* meant P < 0.05 compared with the control group; # suggested P < 0.05 compared with LV-SC group)
Figure 5. Observation results of immunofluorescence double standard method (A: expression of Nav1.7 in LV-SC group; B: CGRP positive cells in LV-SC group; C: double staining map of LV-SC group; D: expression of Nav1.7 in LV-siSCN9A group; E: CGRP positive cells in LV-siSCN9A group; F: double staining map of LV-siSCN9A group)
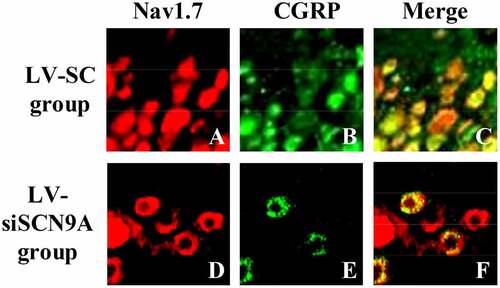
Figure 6. The percentage of Nav1.7 expressed in CGRP positive cells (# suggested P < 0.05 compared with LV-SC group)
Figure 7. The test results of Nav1.7 Western-blot method (A: Nav1.7 protein expression of rats in each group; * meant P < 0.05 compared with the control group; # suggested P < 0.05 compared with LV-SC group; B: Western blotting)
Figure 8. The mRNA expression level of Nav1.7 in each group (* meant P < 0.05 compared with the control group; # suggested P < 0.05 compared with LV-SC group)
Figure 9. Expression of related proteins in rats with vincristine induced pathological pain (A: Western blot electrophoresis; B. NLRP3 protein; C. ASIC3 protein; D. CaMK2α protein; * meant P < 0.05 compared with the control group; # suggested P < 0.05 compared with LV-SC group. B: Western blotting)
Figure 10. Test results of immunohistochemistry (A: percentage of Nav1.7 positive cells; B: CGRP fluorescence intensity; (# suggested P < 0.05 compared with LV-SC group)