Figures & data
Figure 1. MiR-92b promotes HNSCC cell migration, invasion and proliferation. (a) Microarray results show that miR-92b expression levels are higher in PCI-4B and PCI-37B cells than in PCI-4A and PCI-37A cells; (b) MiR-92b expression in HNSCC cells verified by real-time qPCR; (c) MiR-92b expression levels in cells transfected with miR-92b mimics, inhibitor and NC; (d) Mir-92b promotes migratory ability of PCI-37A/B cells, scale bar 50 µm; (e) Mir-92b promotes invasive ability of PCI-37A/B cells, scale bar 50 µm; (f) Wound healing images of PCI-37A/B cells transfected with miR-92b mimics, inhibitor and NC at 0, 24 and 48 hours after scratch, scale bar 100 µm; (g) In CCK8 assay, an increase in miR-92b expression in PCI-37A cells significantly promotes cell viability at 48 and 72 hours after transfection, and a decrease in miR-92b expression in PCI-37B cells inhibits proliferation at 24, 48 and 72 hours after transfection. All experiments were repeated at least three times. *p < 0.05 compared with the NC group; **p < 0.01 compared with the NC group; ***p <0.001 compared with the NC group
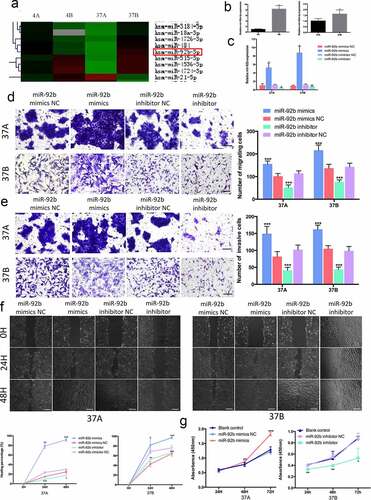
Figure 2. MiR-92b levels are associated with HNSCC progression and metastasis. (a) MiR-92b expression levels in HNSCC patient specimens. (b) Expression levels of miR-92b in adjacent normal tissue, primary tumor and metastatic focus in HNSCC patients from TCGA-HNSC dataset, p<0.0001; (c) MiR-92b expression in stage I&II versus stage III&IV HNSCC patients, p=0.012; (d) MiR-92b expression in N0 versus N+ HNSCC patients, p=0.004; (e) Kaplan-Meier analysis of survival probabilities of HNSCC patients with high and low miR-92b levels in primary tumors, p=0.031. All experiments were repeated at least three times. *p<0.05 compared with the NC group p<0.05; **p<0.01 compared with the NC group; ****p<0.0001 compared with the NC group
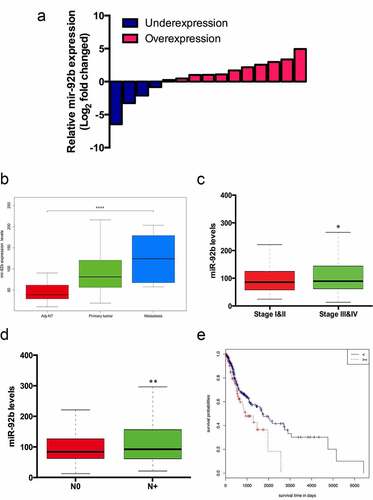
Table 1. Correlation of miR-92b expression and clinical characteristics of HNSCC patients
Table 2. Univariate and multivariate analysis of miR-92b prognosis
Figure 3. SP1 and miR-92b form a positive feedback loop in HNSCC cells. (a) Five possible SP1 binding sites on miR-92b promoter region identified via bioinformatics analysis; (b) SP1 mRNA expression levels in SP1 siRNA and NC groups of PCI-37A/B cells; (c) SP1 protein levels in SP1 siRNA and NC groups of PCI-37A/B cells; (d) Downregulating SP1 expression causes a decrease of miR-92b levels; (e) The SP1 expression levels increase with the increase of miR-92b levels in HNSCC patients’ specimens in TCGA-HNSC dataset, p<0.0001; (f) ChIP assay verifies that SP1 binds to the predicted site 1-3 in miR-92b promoter: (M) marker, (A) experiment group, (B) RT-Input1, (C) negative control group, (D) PCR negative control, (E) positive control group, (F) RT-Input2; (g) Downregulating SP1 expression results in a decrease of cell migratory and invasive abilities in PCI-37A/B cells, scale bar 50 µm; (h) Wound healing images of PCI-37A/B cells transfected with SP1 siRNA and control groups at 0, 24 and 48 hours after scratch, scale bar 100 µm; (i) Proliferation of PCI-4A/37A cells transfected with SP1 siRNA or control groups at 24, 48 and 72 hours after transfection; (j) SP1 mRNA expression levels in PCI-37A/B cells after transfected with miR-92b mimics and inhibitor; (k) SP1 protein levels in PCI-37A/B cells transfected with miR-92b mimics, inhibitor and control groups. All experiments were repeatedat least three times. *p<0.05 compared with the NC group; **p<0.01 compared with the NC group; ***p<0.001 compared with the NC group
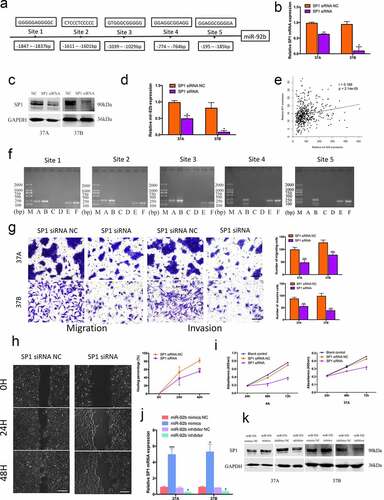
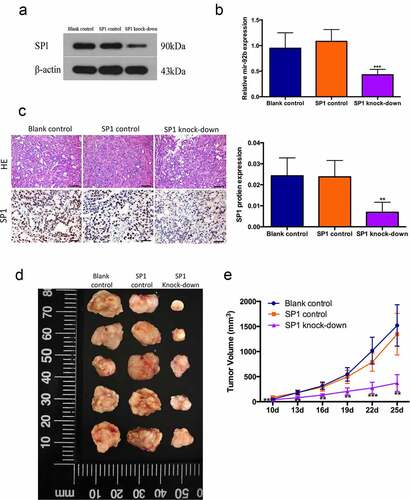
Figure 4. SP1/miR-92b feedback loop affects tumor growth in vivo. (a) SP1 protein levels in blank control, SP1 control and SP1knockdown group cells; (b) MiR-92b levels in xenograft tumors of blank control, SP1 control and SP1 knockdown groups; (c) HE staining and immunohistochemistry staining of SP1 in xenograft tumors of blank control, SP1 control and SP1knockdown groups, scale bar 50um. (d) Images of xenograft tumor of blank control, SP1 control and SP1 knock-down groups; (e) In vivo tumor growth of the blank control, SP1 control and SP1 knockdown groups; All experiments were repeated at least three times. **Compared with the NC group p<0.01; ***Compared with the NC group p<0.001