Figures & data
Table 1. Correlation between circ_0000326 expression and clinicopathological parameters
Figure 1. Circ_0000326 expression was significantly up-regulated in BC. (a). The volcano plot of differentially expressed genes (DECs) in GSE92675. The blue and purple dots represented the downregulated DECs and upregulated DECs with statistical significance (log2 |fold change|>2 and P < 0.05), respectively. (b). The heatmap of DECs whose expressions were upregulated in GSE92675.C-D. qRT-PCR showed that circ_0000326 expression was upregulated in BC tissues and cell lines.***P < 0.001
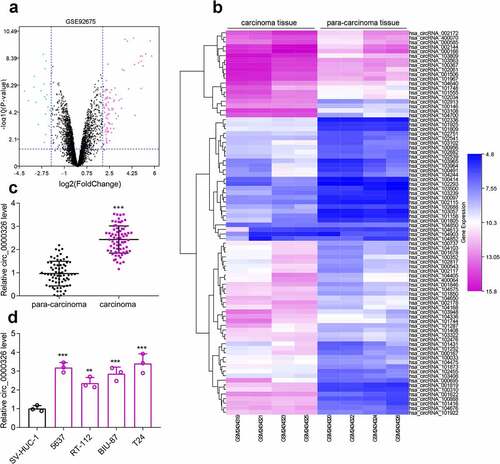
Figure 2. Circ_0000326 promoted BC cell proliferation and migration, and inhibited the apoptosis. (a). qRT-PCR showed that linear MALAT1 was degraded by RNase R, while circ_0000326 could not be degraded by RNase R. (b). qRT-PCR showed that circ_0000326 expression was inhibited in BC cells transfected with circ_0000326 siRNAs. (c-d). CCK-8 assay showed that cell proliferation in the si-circ_0000326#1 and si-circ_0000326#3 groups was dramatically suppressed as against the si-NC group. (e). Would healing assay indicated that in comparison to the control group, cell migration capacity in the si-circ_0000326#1 and si-circ_0000326#3 groups was significantly reduced. (f). Flow cytometry showed that the apoptosis rate was significantly increased after circ_0000326 knockdown.*P < 0.05, **P < 0.01 and ***P < 0.001
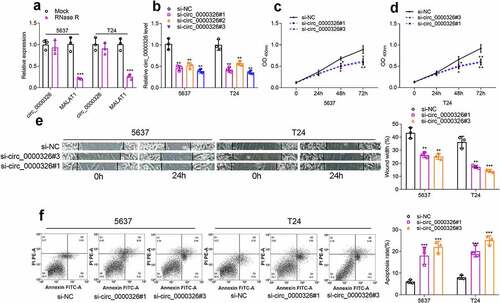
Figure 3. Circ_0000326 could combine with miR-338-3p in BC. (a-b). qRT-PCR indicated that circ_0000326 was mainly distributed in the cytoplasm of 5637 and T24 cell lines. (c). StarBase database was utilized to predict the binding site between circ_0000326 and miR-338-3p. (d). Dual-luciferase reporter assays showed that the luciferase activity of wild-type circ_0000326 reporter was significantly suppressed by miR-338-3p mimics, while the luciferase activity of the mutated reporter was not affected by miR-338-3p mimics. (e). RIP assay showed that circ_0000326 and miR‐338-3p were mainly enriched by anti-Ago2 antibody. (f-g). qRT-PCR showed that miR-338-3p expression was markedly down-regulatedin BC cell lines and tissues. (h). qRT-PCR showed that miR-338-3p expression was significantly increased in BC cells transfected with circ_0000326 siRNA.**P < 0.01 and ***P < 0.001
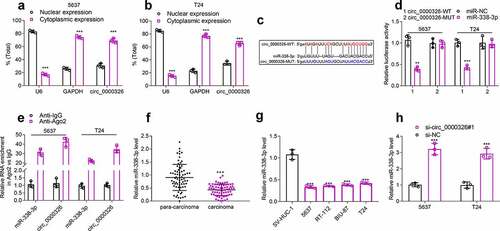
Figure 4. Circ_0000326 could target miR-338-3p to regulate ETS1 expression
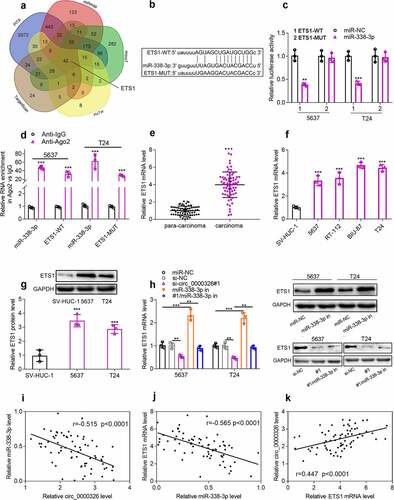
Figure 5. Circ_0000326 could regulate miR-338-3p/ETS1 to participate in BC progression. (a-b). CCK-8 assay was used to verify the cell proliferation in BC cells transfected with si-circ_0000326, circ_0000326 siRNA and miR-338-3p inhibitor, or circ_0000326 siRNA and ETS1 overexpression plasmid. (c-d). Wound healing assay was used to detect the migration of BC cells transfected with si-circ_0000326, circ_0000326 siRNA and miR-338-3p inhibitor, or circ_0000326 siRNA and ETS1 overexpression plasmid. (e-f). Flow cytometry was used to detect the apoptosis of BC cells transfected with si-circ_0000326, circ_0000326 siRNA and miR-338-3p inhibitor, or circ_0000326 siRNA and ETS1 overexpression plasmid. *P < 0.05, **P < 0.01 and ***P < 0.001
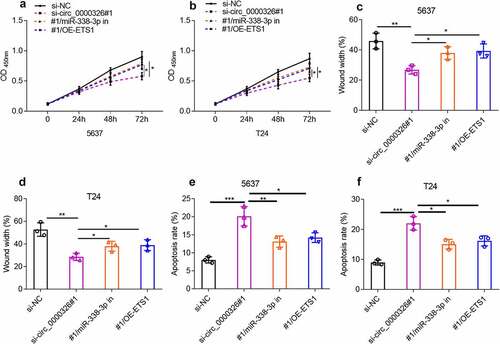
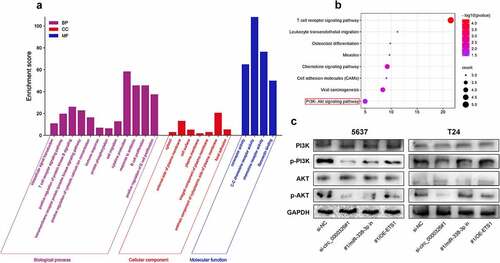
Figure 6. Circ_0000326/miR-338-3p/ETS1 activated PI3K/AKT signal pathway in BC