Figures & data
Figure 1. DDX11-AS1 was up-regulated in ESCC tissues and linked to poor prognosis of ESCC patients. (a) DDX11-AS1 expression was notably elevated in ESCC tissues as opposed to normal tissues, *P < 0.05. (b) DDX11-AS1 expression in tumor and matched contiguous normal tissue of each ESCC patient. (c) The fold change of DDX11-AS1 expression in tumor tissues contrasted with paired adjacent normal tissues. (d) Relative DDX11-AS1 expression level in five human esophageal cancer cell lines identified by RT-qPCR method. Pools: average expression in 10 normal tissues was utilized as normal control. (e) Correlation of the expression level of DDX11-AS1 with clinicopathologic features of ESCC patients. (f-j) Kaplan–Meier univariate survival analysis of DDX11-AS1 and TNM stage, UGIC family history in ESCC cases
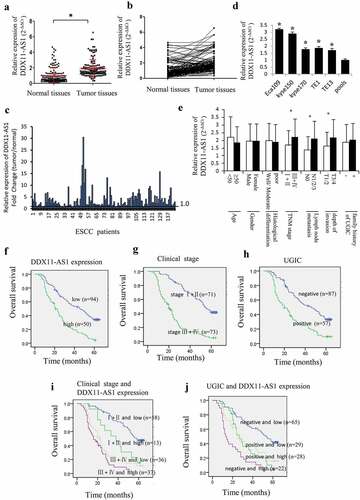
Table 1. Univariate analysis for OS in ESCC cases (Cox’s test)
Table 2. Multivariate analysis for OS in ESCC cases (Cox’s test)
Figure 2. DDX11-AS1 promotes esophageal cancer cells proliferation, migration, and invasion. (a, b) The overexpression efficiency or knockdown of DDX11-AS1 transfect in esophageal cancer cells was identified by the qRT-PCR method. NC, negative control. (c) The Eca109 and Kyse150 cell growth abilities were identified by MTS. *P < 0.05, contrasted with NC cohort. (d, e) The impact of DDX11-AS1 on cell migration and invasiveness ability of Eca109 and Kyse150 cells were identified by transwell invasion assay and wound-healing experiment. *P < 0.05, contrasted with NC cohort. (f-h) The rescue experiments were performed to evaluate the function of DDX11-AS1 in TE13 cells. *P < 0.05, contrasted with NC cohort. #P < 0.05, contrasted with pcDNA3.1-DDX11-AS1 group
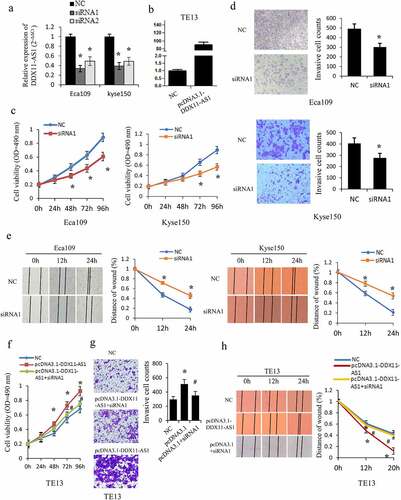
Figure 3. DDX11-AS1 promotes the TGF-β induced EMT process. (a) Cell morphology of Eca109 cells treated or untreated with TGF‑β. (b) Relative expression of EMT-related markers was detected in Eca109 cells with or without TGF‑β treatment. *P < 0.05, contrasted with untreated cohort. (c) Relative expression of DDX11-AS1 was identified in esophageal cancer cells with or without TGF‑β treatment. *P < 0.05, contrasted with the untreated cohort. (d, e) The effect of DDX11-AS1 on the expression of EMT-related markers. *P < 0.05, compared with NC cohort
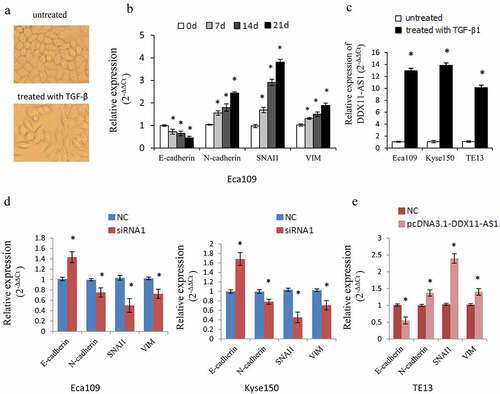
Figure 4. DDX11-AS1 served as a molecular sponge of miR-30d-5p. (a) The subcellular localization of DDX11-AS1 was forecasted by the lncLocator online tool. (b) The subcellular localization of DDX11-AS1 in ESCC cells was identified by the RT-qPCR method. (c) The probable binding sites of DDX11-AS1 to miR-30d-5p were forecasted by LncBase. (d) The miR-30d-5p expression was considerably reduced in ESCC tissues contrasted with normal tissues, *P < 0.05. (e) The relationship between DDX11-AS1 and miR-30d-5p expression was assessed in ESCC tissues. (f) Relative expression of miR-30d-5p in various subgroups. (g) The regulation of DDX11-AS1 on miR-30d-5p expression was identified by the qRT-PCR method. (h) MiR-30d-5p mimic or inhibitor did not affect DDX11-AS1 expression in ESCC cells. (i) The effect of miR-30d-5p mimic on the activity of DDX11-AS1 conveyed by dual-luciferase reporter assay. (j) RNA immunoprecipitation (RIP) assay illustrating the greater enrichment of miR-30d-5p to DDX11-AS1. *P < 0.05, contrasted with NC cohort
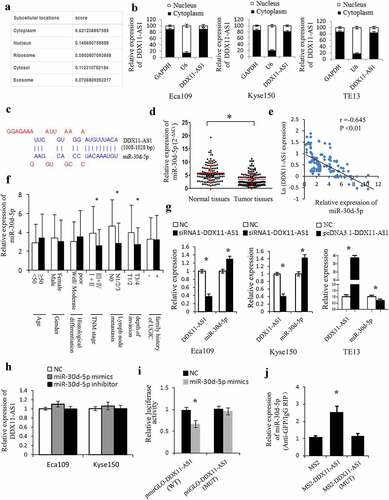
Figure 5. SNAI1 and ZEB2 were the target gene of miR-30d-5p and regulated by DDX11-AS1. (a) The probable target genes of miR-30d-5p are forecasted by miRDB, miRWalk v3.0, and microT-CDS. (b) SNAI1 and ZEB2 expression were considerably elevated in ESCC tissues contrasted with normal tissues, which were measured by qRT-PCR. *P < 0.05. (c) The relationship between SNAI1/ZEB2 and miR-30d-5p expression was assessed in ESCC tissues. (d) The effect of miR-30d-5p mimic/inhibitor on the expression of SNAI1/ZEB2 was reported by qRT-PCR. *P < 0.05, contrasted with NC cohort. (e) The effect of miR-30d-5p mimic/inhibitor on luciferase activity of SNAI1/ZEB2 reported by dual-luciferase reporter assay. *P < 0.05, contrasted with NC cohort. (f) The expression of SNAI1/ZEB2 was upregulated by DDX11-AS1, whereas miR-30d-5p partially rescued the increased effect in ESCC cells. *P < 0.05. (g) MiR-30d-5p partially rescued the upregulation of luciferase activity caused by DDX11-AS1 overexpression. *P < 0.05. (h, i) Cell viability and invasive cell counts were rescued by cotransfection with miR-30d-5p mimics in DDX11-AS1 overexpression cells, which were performed by MTS and transwell invasion assays. *P < 0.05, contrasted with NC cohort, #P < 0.05, contrasted with pcDNA3.1-DDX11-AS1 cohort
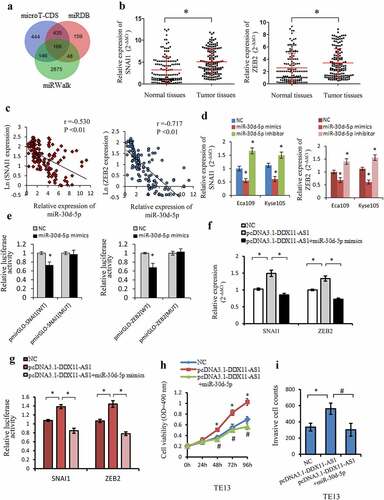
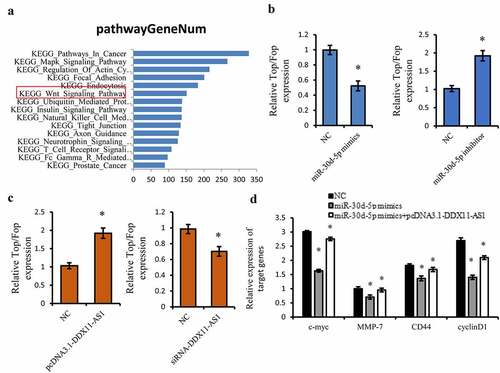
Figure 6. DDX11-AS1 activated the Wnt/β-catenin Signaling pathway via targeting miR-30d-5p. (a) The KEGG pathway analysis on the downstream target genes of miR-30d-5p using Starbase 3.0 online tool. (b, c) The effect of miR-30d-5p or DDX11-AS1 on the TOP/FOP Flash luciferase activity. *P < 0.05. (d) The effect of miR-30d-5p or DDX11-AS1 on downstream target genes of the Wnt pathway. *P < 0.05, contrasted with NC cohort