
Figures & data
Figure 1. Effects of CTS on biological behavior of HASMCs. (a) MTT was used to detect HASMC proliferation. (b) Flow cytometry displayed the apoptosis level of HASMCs in each group. (c) HASMC migration was detected by Transwell. Expression levels of (d) apoptosis-related (Bax, Bcl 2 and Caspase 3) and (e) migration-related proteins (MMP 2 and MMP 9) in the cells of each group of HASMCs. In all cases, Values are mean ± SD (n = 3 for each group; *P < 0.05, **P < 0.01, ***P <0.001). CTS represents cyclic tensile strain; HASMCs stands for human aortic smooth muscle cells
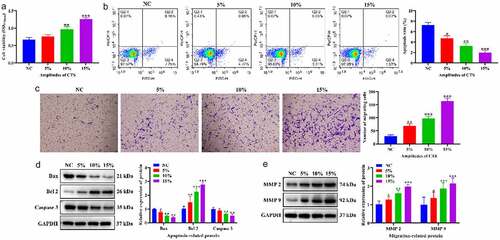
Figure 2. Differentially expressed miRNAs in HASMCs in response to CTS. (a-c) Volcano plots exhibited the differentially expressed miRNAs obtained in the (a) 5%, (b) 10% and (c) 15% groups compared to the NC group, respectively. The thresholds were absolute log2 FC ≥ 1 and P < 0.05. (d-f) Heatmap plots showed the change in expression of differentially expressed miRNAs in NC, 5%, 10% 15% groups. (g) Venn plots indicated the intersection of differentially expressed miRNAs in each group. (h) Venn plots show intersection of downstream target genes of miR-26a-2-3p and miR-187-3p
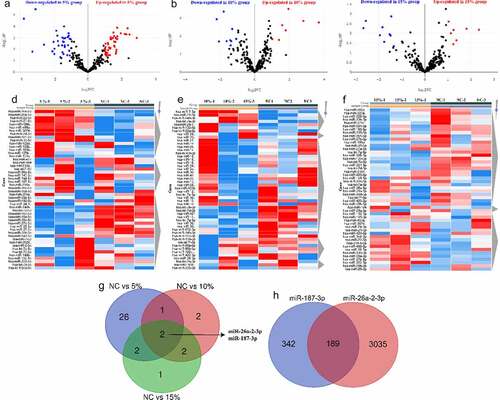
Figure 3. Enrichment analysis of GO function and KEGG pathway. (a and c) Bar plots showed term and pathway enriched by (a) GO and (c) KEGG, respectively. P-value < 0.05, a minimum count of 3, and an enrichment factor > 3.0. (b and d) Network plots exhibited the interactions between (b) each term or (d) each pathway. Each item or pathway was represented by a circle node whose size is proportional to the number of input genes in the item or pathway and whose color indicates its cluster identity
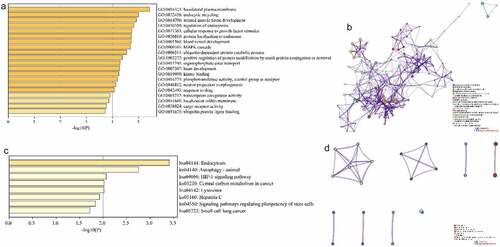
Figure 4. Construction of Protein-protein Interactions (PPI) network. (a) PPI network of target genes. (b) PPI network for each MCODE. (c) GO enrichment analysis was applied to each MCODE network to assign ‘meanings’ to the network components, with the top 3 best P-value terms retained
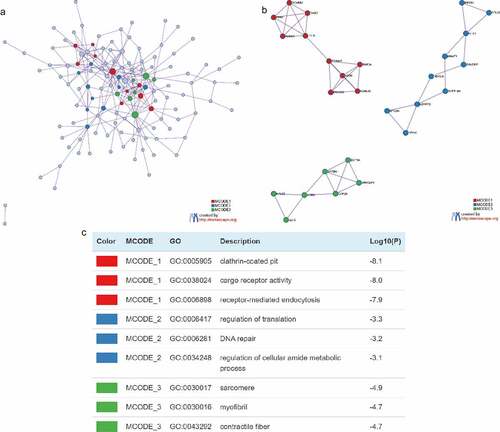
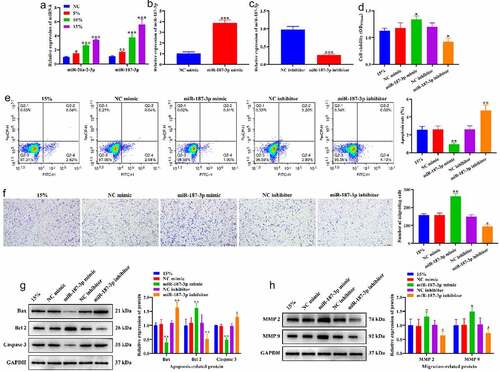
Figure 5. Effects of CTS on biological behavior of HASMCs through miR-187-3p. (a) Effects of CTS on the expression of miR-187-3p and miR-26a-2-3p were detected by RT-qPCR. (b-c) RT-qPCR to detect the transfection efficiency of (b) miR-187-3p mimic and (c) inhibitor. (d) MTT results demonstrate the effect of CTS on HASMC proliferation via regulating miR-187-3p. (e) The apoptosis levels of HASMCs in each group. (f) Transwell was used to detect the migration of HASMCs. Western blotting was used to detect the expression levels of (g) apoptosis related (Bax, Bcl 2 and Caspase 3) and (h) migration-related (MMP2 and MMP 9) proteins in HASMCs cells. In all cases, Values are mean ± SD (n = 3 for each group; *P < 0.05, **P < 0.01, ***P <0.001). CTS represents cyclic tensile strain; HASMCs stands for human aortic smooth muscle cells
Supplemental Material
Download Zip (54.3 KB)Data Availability Statement
Data is applicable after the approval of co-authhors.