Figures & data
Figure 1. Improvement of intestinal integrity by curcumin. (a) Intact tight junctions in the ileal tissues were investigated through HE staining; (b) Intact tight junctions in the ileal tissues were investigated through TEM; (c) The contents of DAO in the serum were measured; (d) Tight junction width in the ileal tissue were investigated; (e) The protein expression of occludin and ZO-1 were measured through immunofluorescence staining; (f) The protein expression of occludin and ZO-1 were analyzed. *P< 0.05 compared to control group. #P < 0.05 compared to the HFD group. White arrows indicate tight junctions and red arrows indicate tight junctions’ disruption. Ten rats were used in each group. Three independent experiments were performed to detect DAO, tight junction width, and expression of tight junction proteins
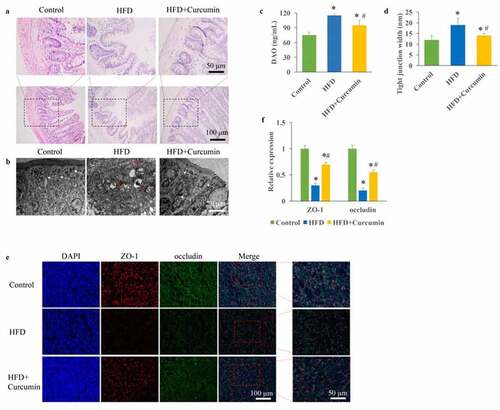
Figure 2. Curcumin improved hyperglycemia and insulin resistance in diabetic mice. (a) Curcumin significantly slowed down the increase of body weight caused by HFD; (b) The glucose tolerance test was measured to investigate the influence of curcumin on hyperglycemia-lowering effect; (c) The insulin tolerance test was measured to investigate the influence of curcumin on hyperglycemia-lowering effect; (d) The levels of fasting insulin and HOMA-IR were measured. *P < 0.05 compared to control group. #P < 0.05 compared to the HFD group. Ten rats were used in each group. Three independent experiments were performed in these experiments
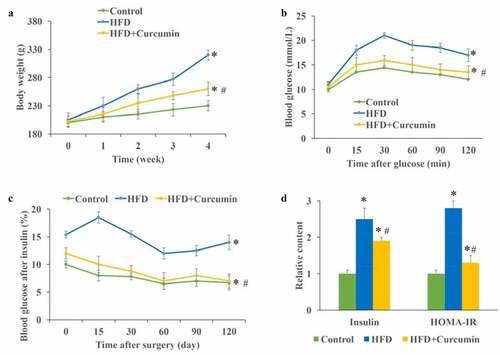
Figure 3. Inhibition of metabolic endotoxemia by curcumin. (a) The increased LPS caused by HFD was decreased by curcumin; (b) The increased TNF-α caused by HFD was decreased by curcumin; (c) The TLR4 expression and NF-κB activation were measured through Western blotting; (d) The increase of TLR4 and NF-κB activation caused by HFD were reduced by curcumin administration. *P < 0.05 compared to control group. #P < 0.05 compared to the HFD group. Ten rats were used in each group. Three independent experiments were performed in these experiments
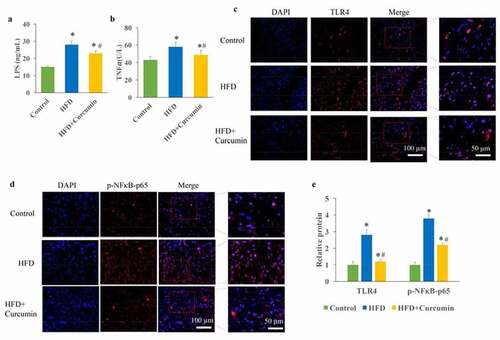
Figure 4. Curcumin reversed gut microbiota dysbiosis in diabetic mice. (a) The gut microbiota dysbiosis change caused by HFD was reversed by curcumin; (b) The differently expressed genes in the tissues between the HFD group and HFD+curcumin group were analyzed through Pheatmap method; (c) The differently expressed genes in the tissues between HFD group and HFD+curcumin group were analyzed through volcano plot method; (d) The differently expressed genes in the tissues between the HFD group and the HFD+curcumin group were analyzed through scatter plot method. *P < 0.05 compared to group control. #P < 0.05 compared to the HFD group. Ten rats were used in each group. Three independent experiments were performed in these experiments
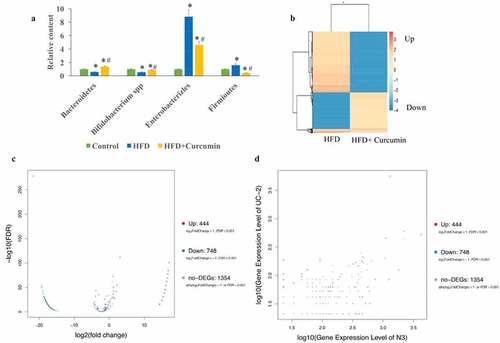
Figure 5. Influence of curcumin on the metabonomics of HFD animals. (a) PLS-DA was used to investigate the influence of curcumin on the metabonomics of HFD animals; (b) OPLS-DA was used to investigate the influence of curcumin on the metabonomics of HFD animals; (c) The DEGs number of the most enriched pathway was analyzed through gene ontology. Ten rats were used in each group. Three independent experiments were performed in these experiments
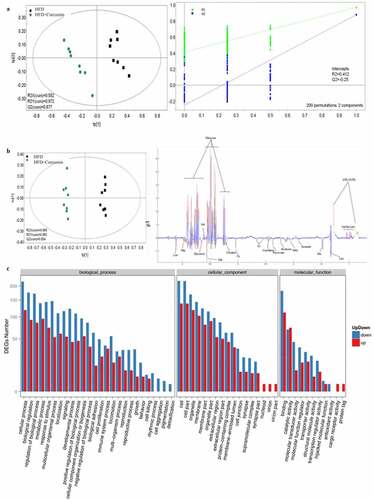
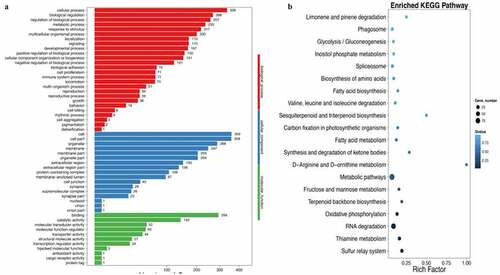
Figure 6. Gene ontology and enriched KEGG biological pathway analysis. (a) Gene ontology analysis was used to investigate biological, cellular component, and molecular function processes; (b) Enriched KEGG method was used to analyze differentially expressed genes. Ten rats were used in each group. Three independent experiments were performed in these experiments