Figures & data
Figure 1. B7-H4 expression is elevated in CRC tissues. A. B7-H4 mRNA expression levels was detected in a total of 80 pairs of CRC tissues and adjacent normal tissues by RT-qPCR. B. The expression levels of B7-H4 in 80 pairs of CRC tissues and adjacent tissues were evaluated by immunohistostaining (IHC). Images showed the examples of IHC staining in 3 paired tissues. Scale bar: 100 μm. C. The expression levels of B7-H4 in 5 pairs of CRC tissues and adjacent normal tissues were analyzed by Western blot. **, P < 0.01, and ***, P < 0.001. The error bars are defined as S.D
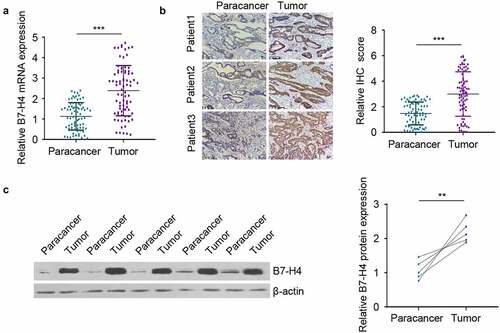
Table 1. The expression intensity of B7-H4 in CRC and paracancer tissues
Figure 2. High level of B7-H4 expression is associated with poor prognosis of CRC patients. a. The morphology of tumor section was evaluated by H&E staining, and the expression of B7-H4 in tissues was detected by IHC. Scale bar: 100 μm. b. Overall survival was analyzed using Kaplan Meier Curve and log-rank test in B7-H4 high expression and low expression groups. c. Cumulative recurrence rate was analyzed in B7-H4 high expression and low expression groups. d, e, f and g. Patients were divided in different groups based on B7-H4 expression level together with pathological tissue type (d) or lymphatic metastasis (e) or tumor cell differentiation (f) or tumor TNM grade (g) to assess the overall survival of CRC patients
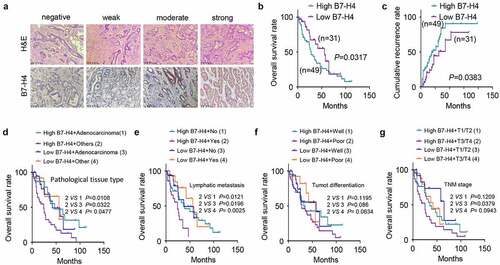
Figure 3. B7-H4 positively regulates the proliferation, migration and invasion of CRC cells. a, b. The expression levels of B7-H4 protein and mRNA in normal human colonic epithelial cells (FHC) and CRC cells (HT29, HCT116, HCT8, LOVO, SW420 and SW620) were detected by Western blot (a) and RT-qPCR (b), respectively. c. SW620 and LOVO cells were transfected with si-B7-H4, B7-H4 expression plasmid or the corresponding control. B7-H4 expression level in each group was detected by Western blot. d. The proliferation ability of CRC cells was examined by CCK-8. e and f. The migration (e) and invasion (f) ability of CRC cells was evaluated by transwell assay. *, P < 0.05, **, P < 0.01, and ***, P < 0.001. The error bars are defined as s.d
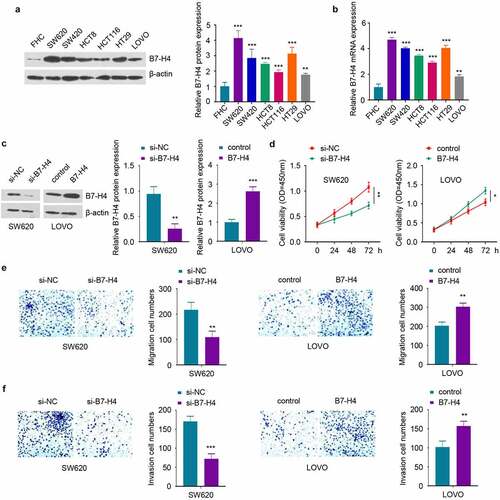
Figure 4. B7-H4 promotes EMT of CRC cells by activating Wnt signaling pathway. a, b. The protein and mRNA expression of EMT-related genes were detected by Western blot and RT-qPCR after B7-H4 overexpression. c. RNA-seq data in the TCGA database (containing 473 CRC samples, divided into high (h) and Low(l) B7-H4 expression groups) was analyzed by GSEA, and Wnt signaling pathway was significantly enriched in the genes upregulated in the high (h) expression group. d. The mRNA expression levels of Wnt signaling pathway genes (wnt3, β-catenin and C-MYC) were examined in CRC tumor and para-cancer tissues by RT-qPCR. e. The mRNA expression levels of wnt3, β-catenin and C-MYC in different CRC cell lines were detected by RT-qPCR and Western blot. f. The invasive ability of CRC cells after B7-H4 overexpression in the presence of Wnt signaling pathway inhibitor (capmatinib) was evaluated by transwell invasion assay. *, P < 0.05, **, P < 0.01, and ***, P < 0.001. The error bars are defined as s.d
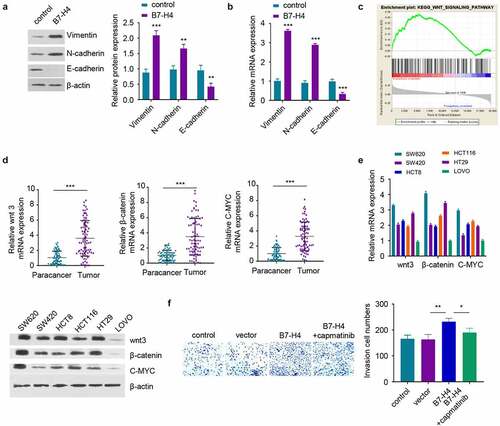
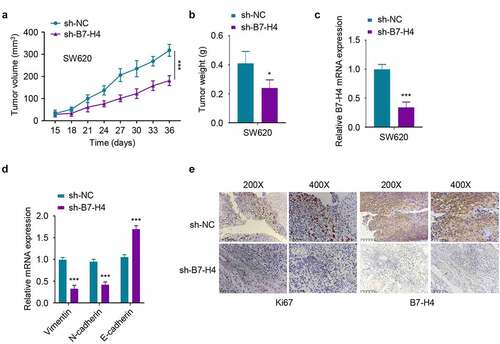
Figure 5. Silencing B7-H4 inhibits tumor growth in mice. 5χ106 SW620 cells stably expressing sh-B7-H4 or sh-NC were inoculated subcutaneously in nude mice. a. The tumor volume was measured every 3 days in each group. b. The xenograft tumor weight in each group was weighed at the end of the experiment. c, d The mRNA expression levels of B7-H4 (c), Vimentin, N-cadherin and E-cadherin (d) in the tumor samples were assessed by RT-qPCR. e. The Ki67 and B7-H4 expression levels in tumor sections were assessed by IHC staining. Scale bar: 100 μm *, P < 0.05, **, P < 0.01, and ***, P < 0.001. The error bars are defined as S.D