Figures & data
Table 1. The relation between circ_0000654 expression and the characteristics of patients with GC
Figure 1. Circ_0000654 is up-regulated in GC. A. circ_0000654 expression inGC tissues and normal tissues (RT-qPCR); B. circ_0000654 expression in GES-1 and GC cell lines (RT-qPCR); C. Genomic location and structural characteristics of circ_0000654; D. Resistance of circ_0000654 to RNase R; The value was expressed as mean ± standard deviation. Experimental repetitions = 3. Data comparison used t test or one way AVONA, * P < 0.05 vs. GES1 cells.
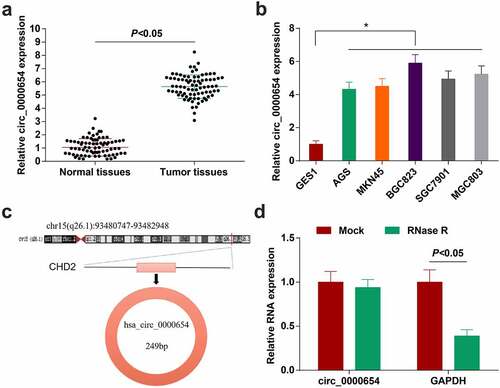
Figure 2. Silencing circ_0000654 inhibits the progress of GC cell biology while overexpressing circ_0000654 acts oppositely. A. circ_0000654 expression in BGC-823 cells transfected with circ_0000654 siRNA or overexpression plasmid (RT-qPCR); B. Proliferation of BGC-823 cells transfected with circ_0000654 siRNA or overexpression plasmid (CCK-8 assay); C. Apoptosis of BGC-823 cells transfected with circ_0000654 siRNA or overexpression plasmid (flow cytometry); D. Migration of BGC-823 cells transfected with circ_0000654 siRNA or overexpression plasmid (scratch test); E. Invasion of BGC-823 cells transfected with circ_0000654 siRNA or overexpression plasmid (Transwell assay); The value was expressed as mean ± standard deviation. Experimental repetitions = 3. Data comparison used t test or one way AVONA, * P < 0.05 vs. the si-NC group; & P < 0.05 vs. the vector.
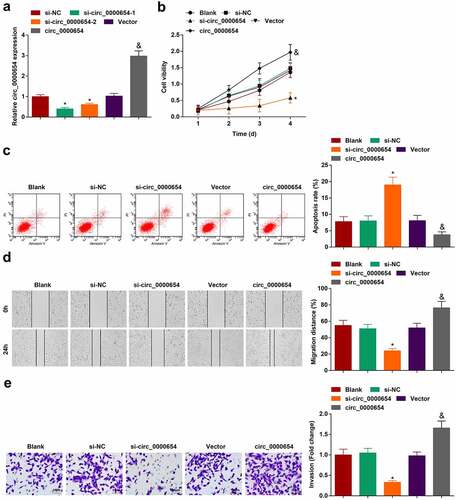
Figure 3. miR-149-5p is down-regulated in GC; overexpression of miR-149-5p retards the progress of GC cells. A. miR-149-5p expression in 80 pairs of GC tissues and normal tissues (RT-qPCR); B. miR-149-5p expression in GES-1 and GC cell lines (RT-qPCR); C. miR-149-5p expression in BGC-823 cells transfected with miR-149-5p mimic (RT-qPCR); D. Proliferation of BGC-823 cells transfected with miR-149-5p mimic (CCK-8 assay); E. Apoptosis of BGC-823 cells transfected with miR-149-5p mimic (flow cytometry); F. Migration of BGC-823 cells transfected with miR-149-5p mimic (scratch test); G. Invasion of BGC-823 cells transfected with miR-149-5p mimic (Transwell assay); The value was expressed as mean ± standard deviation. Experimental repetitions = 3. Data comparison used t test, * P < 0.05 vs. GES1 cells, & P < 0.05 vs. the NC mimic group.
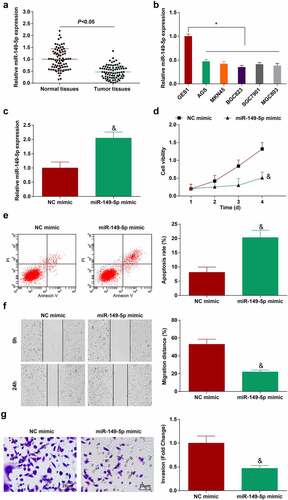
Figure 4. Circ_0000654 absorbs miR-149-5p to target INHBA. A. miR-149-5p in BGC-823 cells transfected with si-circ_0000654 (RT-qPCR); B. The presence of binding sites between miR-149-5p and circ_0000654 (http://starbase.sysu.edu.cn/); C. Interaction between miR-149-5p and circ_0000654 (dual luciferase reporter experiment); D. Interaction between miR-149-5p and circ_0000654 (RNA pull-down assay); E. INHBA expression in 80 pairs of GC tissues and normal tissues (RT-qPCR); F. INHBA expression in GES-1 and BGC-823 cells (RT-qPCR); G. The binding sites of miR-149-5p and INHBA (https://cm.jefferson.edu/); H. Interaction between miR-149-5p and INHBA (dual luciferase reporter experiment); I. Interaction between miR-149-5p and INHBA (RNA pull-down assay); J. INHBA expression in BGC-823 cells transfected with si-circ_0000654 (RT-qPCR and Western blot); K. INHBA expression in BGC-823 cells transfected with miR-149-5p mimic (RT-qPCR and Western blot). The value was expressed as mean ± standard deviation. Experimental repetitions = 3. Data comparison used t test, * P < 0.05 vs. the si-NC group, & P < 0.05 vs. the NC mimic group; ^ P < 0.05 vs. GES1 cells.
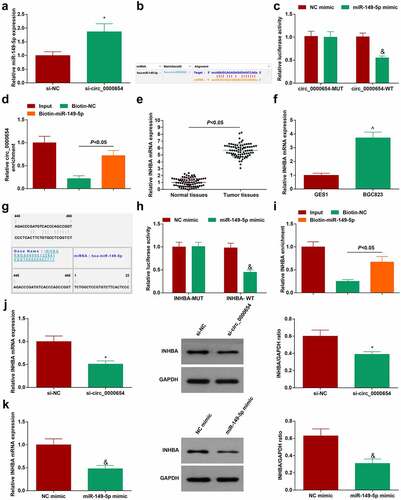
Figure 5. Inhibiting miR-149-5p rescues down-regulated circ_0000654-induced anti-tumor effect on GC. A. Proliferation of BGC-823 cells co-transfected with si-circ_0000654 and miR-149-5p-inhibitor (CCK-8 assay); B. Apoptosis of BGC-823 cells co-transfected with si-circ_0000654 and miR-149-5p-inhibitor (flow cytometry); C. Migration of BGC-823 cells co-transfected with si-circ_0000654 and miR-149-5p-inhibitor (scratch test); D. Invasion of BGC-823 cells co-transfected with si-circ_0000654 and miR-149-5p-inhibitor (Transwell assay); E. INHBA expression in BGC-823 cells co-transfected with si-circ_0000654 and miR-149-5p-inhibitor (RT-qPCR and Western blot). The value was expressed as mean ± standard deviation. Experimental repetitions = 3. Data comparison used t test, * P < 0.05 vs. the si-circ_0000654 + NC inhibitor group.
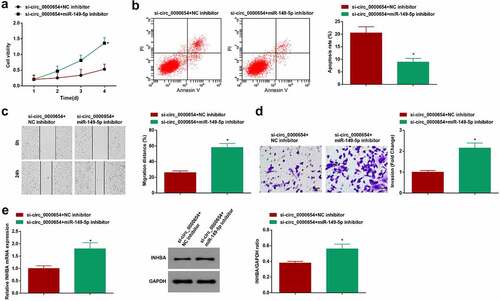
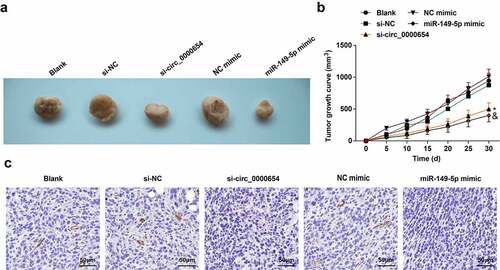
Figure 6. Circ_0000654 silence or miR-149-5p overexpression limits the growth of GC tumors. A. Tumors of mice after silencing circ_0000654 or overexpression of miR-149-5p (n = 5); B. Tumor growth of mice after silencing circ_0000654 or overexpression of miR-149-5p (n = 5); C. INHBA expression in tumors after silencing circ_0000654 or overexpression of miR-149 (IHC). The value was expressed as mean ± standard deviation. Experimental repetitions = 3. Data comparison used one-way ANOVA, * P < 0.05 vs. the si-NC group; & P < 0.05 vs. the NC mimic group.