Figures & data
Figure 1. MiR-99b-5p was downregulated in PCa tissues and upregulated in HBMSCs-derived exosomes. The expression of miR-99b-5p in PCa tissues (n = 30) (a), PCa cell lines (b) and HBMSCs-derived exosomes (c) was detected by qRT-PCR. ** p < 0.01, *** p < 0.001.
Figure 2. IGF1R was a target of miR-99b-5p. (a) The expression of IGF1R in PCa cell lines was detected by qRT-PCR. (b) The correlation between the expression levels of miR-99b-5p and IGF1R in PCa tissues was evaluated by correlation analysis. (c) The putative binding site between miR-99b-5p and IGF1R was predicted by Targetscan. (d) Luciferase reporter assay. (e and f) The expression of IGF1R in miR-99b-5p mimics transfected LNCaP cells was measured by qRT-PCR (e) and Western blot analysis (f). (g) The expression of IGF1R in HBMSCs-derived exosomes was detected by Western blot analysis. ** p < 0.01, *** p < 0.001.
Figure 3. HBMSCs-derived exosomes inhibited the progression of LNCaP cells. (a) The morphological characteristics of HBMSCs by the inverted microscope. (b) The ultrastructure of exosomes by a transmission electron microscope (TEM). (c) The analysis of exosomes by Western blot to detect relative exosomes-related markers. (d-g) LNCaP cells were treated with HBMSCs-derived exosomes for different times (CCK-8 assay), EdU assay and Transwell assay (72 h). (d) The cell viability of LNCaP cells by CCK-8 assay. (e) The proliferation of LNCaP cells by EdU staining assay. Scale bar = 40 μm. (f) The migration and invasion of LNCaP cells by Transwell assay. Scale bar = 100 μm. (g) The expression of exosomes related markers was analyzed by Western blot analysis. ** p < 0.01, *** p < 0.001.
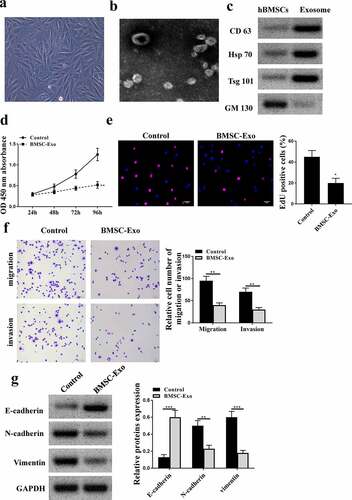
Figure 4. MiR-99b-5p inhibitor transfected HBMSCs-derived exosomes promoted the progression of LNCaP cells. (a and b) HBMSCs were transfected with miR-99b-5p inhibitor or inhibitor NC. The expression of miR-99b-5p in HBMSCs (a) and HBMSCs-derived exosomes (b) was detected by qRT-PCR. (c-f) 20 ug HBMSCs-derived exosomes were used to treat LNCaP cells. (c) The cell viability of LNCaP cells by CCK-8 assay. (d) The proliferation of LNCaP cells by EdU staining assay. Scale bar = 40 μm. (e) The migration and invasion of LNCaP cells by Transwell assay. Scale bar = 100 μm. (f) The expression of exosomes related markers was analyzed by Western blot analysis. * p < 0.05, ** p < 0.01.
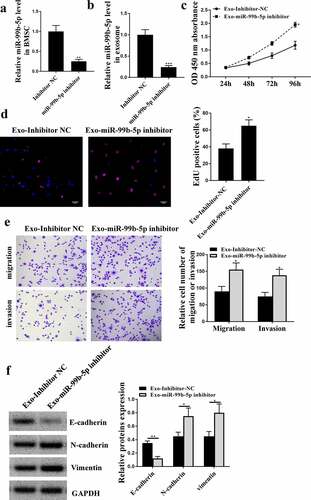
Figure 5. MiR-99b-5p mimics transfected HBMSCs inhibited the progression of LNCaP cells. HBMSCs were transfected with miR-99b-5p mimics or miR-NC, and transfected HBMSCs were co-cultured with LNCaP cells. (a) The expression of HBMSCs-derived exosomes was detected by qRT-PCR. (b) The cell viability of LNCaP cells by CCK-8 assay. (c) The proliferation of LNCaP cells by EdU staining assay. Scale bar = 40 μm. (d) The migration and invasion of LNCaP cells by Transwell assay. Scale bar = 100 μm. (e) The expression of exosomes related markers was analyzed by Western blot analysis. * p < 0.05, ** p < 0.01, *** p < 0.001.
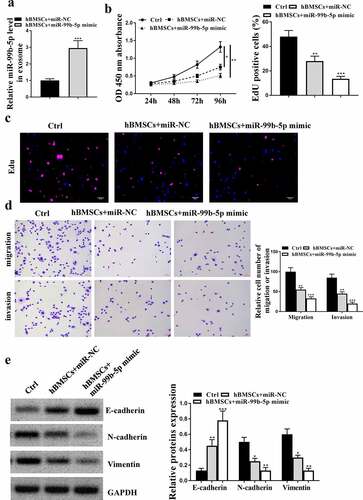
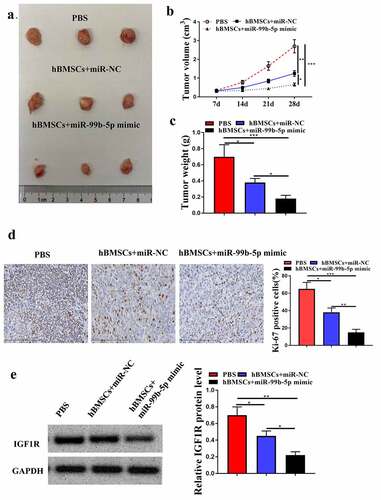
Figure 6. MiR-99b-5p mimics-transfected HBMSCs-derived exosomes inhibited tumor growth. (a) Tumor images. (b) Tumor volume. (c) Tumor weight. (d) Immunohistochemistry assay with anti-Ki67 antibody. (e) The expression of IGF1R in tumor tissues was detected by Western blot analysis. * p < 0.05, ** p < 0.01, *** p < 0.001.