
Figures & data
Table 1. The sequence of PCR primers in this study
Figure 1. The identification of genes of interest in osteoporosis. (a). The top 20 enriched GO terms of the differentially expressed genes (DEGs) from GSE37558 data series. DEGs selection criteria: adjusted P < 0.05, log|FC|≥2. FC: fold change. (b). The six AMPK signaling pathway-related DEGs and their expression levels in GSE37558 data series. (c). The key network that involves LEP, LEPR, and IRS2 from AMPK signaling pathway
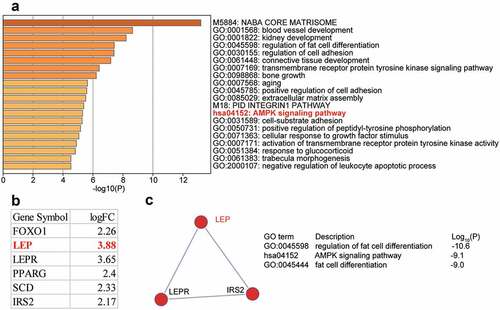
Figure 2. MiR-874-3p promotes the differentiation of hBMSCs into osteoblasts for the treatment of osteoporosis. (a). Determination of the expression of miR-874-3p in femoral neck trabecular bones of OP patients (n = 35) and non-OP patients (n = 35) by qRT-PCR. (b). The expression levels of miR-874-3p were quantified by qRT-PCR on days 0, 3, 7, and 16 after the osteogenic differentiation of hBMSCs. (c). The expression of miR-874-3p was determined by qRT-PCR in hBMSCs transfected with the miR-874-3p mimic or negative control (NC). (d). After 24, 48 and 72 h cultured, cell proliferation was detected by CCK-8 assay in hBMSCs transfected with miR-874-3p mimic. E-H. The expression levels of ALP, RUNX2, OCN and OSX were determined by qRT-PCR in hBMSCs transfected with the miR-874-3p mimic. I. The hBMSCs were overexpressed with miR-874-3p after 16 days of osteogenic differentiation and underwent ARS staining to detect calcium deposition. n = 3, repetition = 3. * P < 0.05, ** P < 0.001. Student’s t-test, One-way or two-way ANOVA were used in statistical analysis. Control, blank control
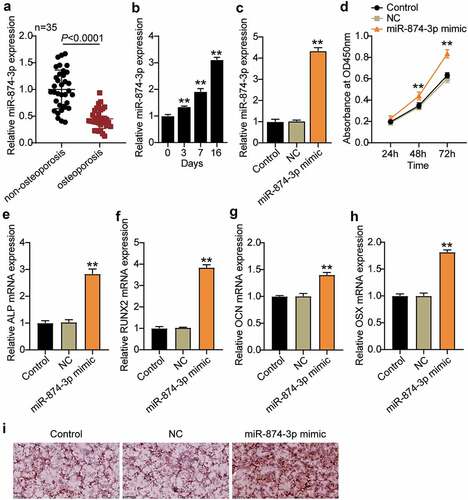
Figure 3. MiR-874-3p negatively regulates the expression of LEP in hBMSCs. (a). Determination of the expression of LEP mRNA in femoral neck trabecular bones of OP patients (n = 35) and non-OP patients (n = 35) by qRT-PCR. (b). Pearson analysis of correlation between miR-874-3p and LEP in femoral neck trabecular bones of OP patients. (c). The expression levels of miR-874-3p were quantified by qRT-PCR on days 0, 3, 7, and 16 during hBMSCs osteogenic differentiation. (d). Schematic diagram of predicted binding sites of LEP in 3ʹ-UTR of miR-874-3p. (e). Detection of LEP enrichment on miR-874-3p in BMSCs by RNA pull-down. (f). Determination of the dual-luciferase activity of hBMSCs transfected with LEP-MUT or LEP-WT and miR-874-3p mimic or mimic NC. (g). Determination of the mRNA expression levels of LEP in hBMSCs transfected with miR-874-3p mimic or/and oe-LEP by qRT-PCR. (h). Determination of the protein expression of LEP in BMSCs transfected with miR-874-3p mimic or/and oe-LEP by Western blot. n = 3, repetition = 3. * P < 0.05, ** P < 0.001 compared with NC group; ## P < 0.001 compared with mimic+oe-LEP group. One-way ANOVA was used in statistical analysis. Control, blank control
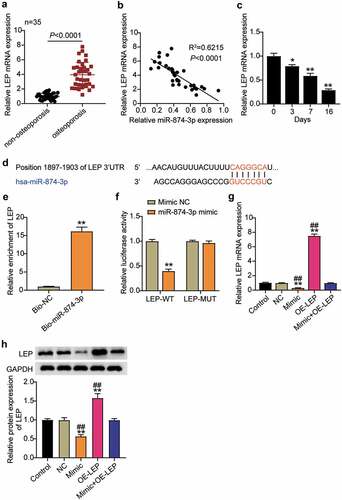
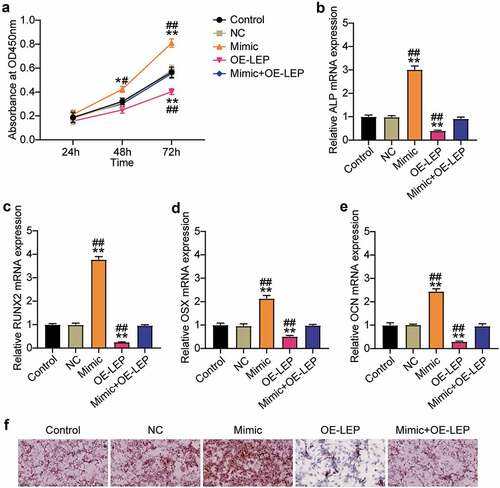
Figure 4. Overexpression of LEP reverses the effect of miR-874-3p mimic on osteogenic differentiation of hBMSCs. (a). After 24, 48 and 72 h culture, cell proliferation was detected by CCK-8 assay in hBMSCs transfected with miR-874-3p mimic or/and oe-LEP. (b)-(e). In the hBMSCs transfected with miR-874-3p mimic or/and oe-LEP, the expression levels of ALP, RUNX2, OCN and OSX were determined by qRT-PCR. (f). The hBMSCs were overexpressed with miR-874-3p mimic or/and LEP after 16 days of osteogenic differentiation and underwent ARS staining to detect calcium deposition. n = 3, repetition = 3. * P < 0.05, ** P < 0.001 compared with NC group; # P < 0.005, ## P < 0.001 compared with mimic+oe-LEP group. One-way or two-way ANOVA was used in statistical analysis. Control, blank control
Supplemental Material
Download Zip (10.7 KB)Data availability statement
The datasets used and/or analyzed during the current study are available from the corresponding author on reasonable request.