
Figures & data
Table 1. Baseline characteristics of study population
Figure 1. Increased fecal microbial diversity in patients with DM vs healthy controls.(a)Rarefaction Curve.(b) Rank abundance curve.(c) Venn diagram displaying the overlaps between groups showing that 3362 of the total richness of 23,839 OTUs were shared between the CAD patients and the healthy controls. OTUs: operational taxonomy units.(d) Circle packing chart
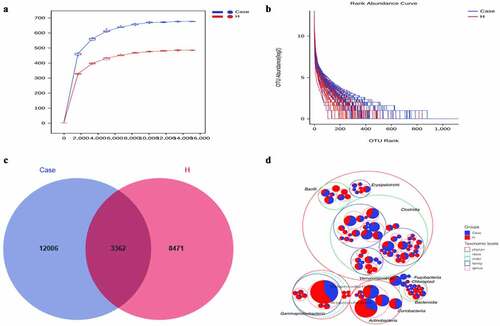
Figure 2. Stacked histogram of species composition in the top 10 of each group. (a) Phylum level. (b) Family level. (c) Genus level. (d) Species level
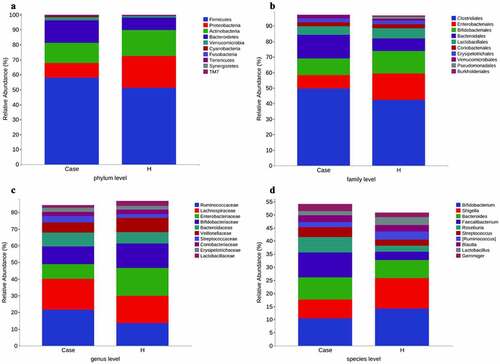
Figure 3. Comparison of fecal microbial diversity, as estimated by the Chao1 index and Shannon index (a), Faith-pd index and Observed_species index (b)
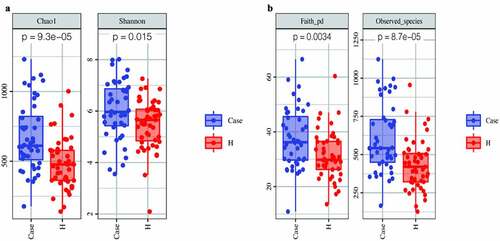
Figure 4. Beta diversity was calculated using unweighted UniFrac [left] or brau_curtis [right] by PCoA and NMDS, indicating a symmetrical distribution of fecal microbial community among all the samples
![Figure 4. Beta diversity was calculated using unweighted UniFrac [left] or brau_curtis [right] by PCoA and NMDS, indicating a symmetrical distribution of fecal microbial community among all the samples](/cms/asset/12a17878-58d5-4269-9431-8488dcf7f231/kbie_a_2009752_f0004_oc.jpg)
Figure 5. Phylogenetic profifiles and differences of gut microbes between patients and healthy controls. [A] LEfSe method identifified the most differentially abundant taxons between the patients and healthy controls. [B] Heatmap of correlation between differential bacteria and clinical indicators. #: Tentative names in greenenes database
![Figure 5. Phylogenetic profifiles and differences of gut microbes between patients and healthy controls. [A] LEfSe method identifified the most differentially abundant taxons between the patients and healthy controls. [B] Heatmap of correlation between differential bacteria and clinical indicators. #: Tentative names in greenenes database](/cms/asset/1b24794d-2711-43d6-a8ca-74d7027236d5/kbie_a_2009752_f0005_oc.jpg)
Figure 6. Important biomarkers. [A] The top 12 bacteria belong to the genus level. [B] ROCs curve with AUC for the diagnostic performance of the gut microbial model. [C] Comparison of the POD of gut microbiome. [Ruminococcus] Temporary name
![Figure 6. Important biomarkers. [A] The top 12 bacteria belong to the genus level. [B] ROCs curve with AUC for the diagnostic performance of the gut microbial model. [C] Comparison of the POD of gut microbiome. [Ruminococcus] Temporary name](/cms/asset/4fd1c542-0214-4442-af84-108093cba2dd/kbie_a_2009752_f0006_oc.jpg)
Table 2. Candidate variables for clinical model development
Figure 7. Instructions for using the nomogram
Figure 8. [A] Calibration curve. [B] The AUCs for the diagnostic performances of the clinical model, microbiome model and the combined model
![Figure 8. [A] Calibration curve. [B] The AUCs for the diagnostic performances of the clinical model, microbiome model and the combined model](/cms/asset/31f12302-811e-47a8-a8dd-0acb1438368b/kbie_a_2009752_f0008_oc.jpg)