
Figures & data
Table 1. Top 10 upregulated and downregulated circRNAs ranked by fold changes after SCI
Figure 1. Hierarchical clustering of circRNAs expression. C1/3/4 refers to the peripheral blood samples of sham control group, and T1/2/4 refers to the peripheral blood samples of SCI group. (a) Hierarchical cluster analysis included 13,279 circRNAs in ACI group and sham control group. (b) Hierarchical cluster analysis includes differentially expressed circRNAs (P < 0.05; folding change≥2). There was significant difference between ACI group and sham operation group
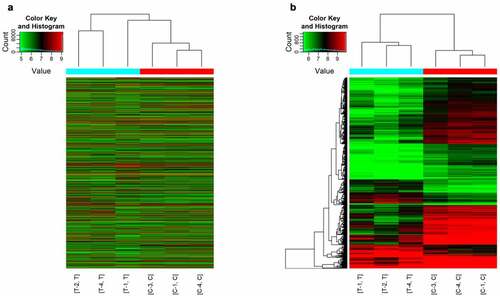
Figure 2. Difference of expression profiles of circRNAs between two groups. (a) Scatter plot show the difference of circRNAs expression between sham operation group and ACI group. The x-axis and y-axis values in the scatter plot are the normalized signal values of samples (log-2 scale) or the average normalized signal values of sample groups (log-2 scale). The green line is the fold change line. The circRNAs above and below the green line represent those circRNAs which show at least 2-fold changes in expression. (b) Volcano map show that cyclic ribonucleic acid was differentially expressed with statistical significance (P < 0.05; folding change ≥ 2). (c) The distribution of circRNAs indicated that the dysregulated circRNAs originated from each chromosome. (d) The classification bar chart of circRNAs based on gene source shows that most cyclic ribonucleic acids changed after ACI are exons
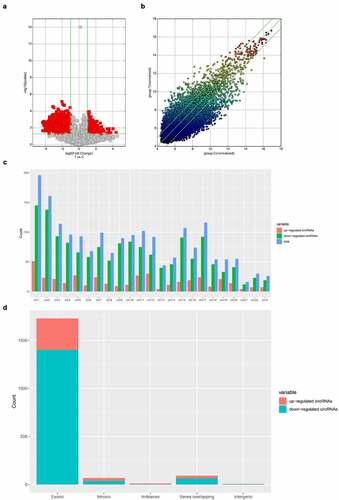
Table 2. The five highest-ranking miRNA candidates for top 10 upregulated and downregulated circRNAs
Table 3. Comparison of candidate circRNAs expression in microarray and PCR
Table 4. Sequences of primers used for qRT-PCR assay
Figure 3. qRT-PCR validation of five selected circRNAs. (a) Relative expression levels of has_circRNA_103372. (b) Relative expression levels of has_circRNA_000581. (c) Relative expression levels of has_circRNA_102183. (d) Relative expression levels of has_circRNA_101836. (e) Relative expression levels of has_circRNA_092476. Compared with the control, rno_circRNA_000581/102,183/101,838/092476 were significantly downregulated. However, rno_circRNA_103372 was significantly upregulated. The data are normalized using the mean ± SEM (*P < 0.05; n = 6 per group)
Figure 4. The circRNA/miRNA/mRNA network analysis. The network includes 5 brown nodes circRNAs, 13 red nodes miRNAs and 655 blue nodes mRNAs
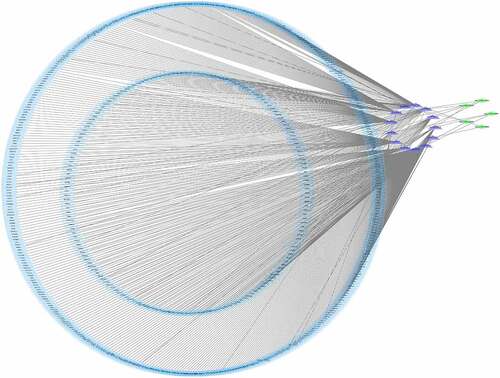
Figure 5. The GO annotations for biological process of target mRNAs regulated by the five candidate circRNAs. Pie (a), bar (b) point charts (c), and dot plot (d) showed the top 10 counts of significant enrichment items
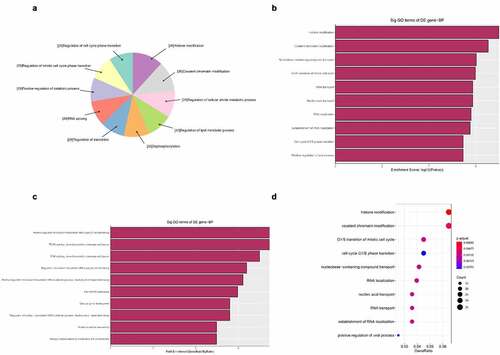
Figure 6. The GO annotations for cellular component of target mRNAs regulated by the five candidate circRNAs. Pie (a), bar (b) point charts (c), and dot plot (d) showed the top 10 counts of significant enrichment items
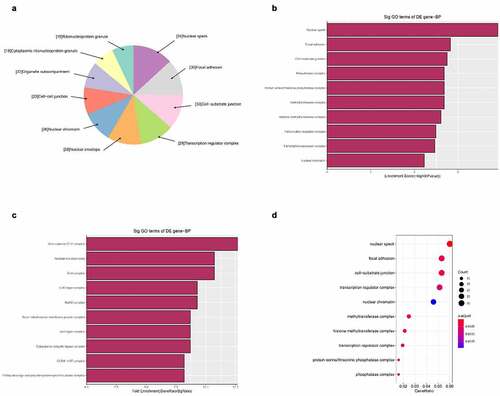
Figure 7. The GO annotations for molecular function of target mRNAs regulated by the five candidate circRNAs. Pie (a), bar (b) point charts (c), and dot plot (d) showing the top 10 counts of significant enrichment items
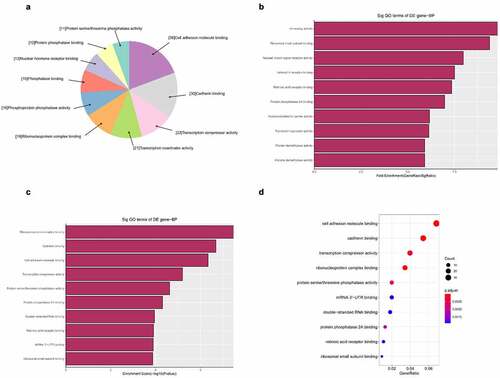
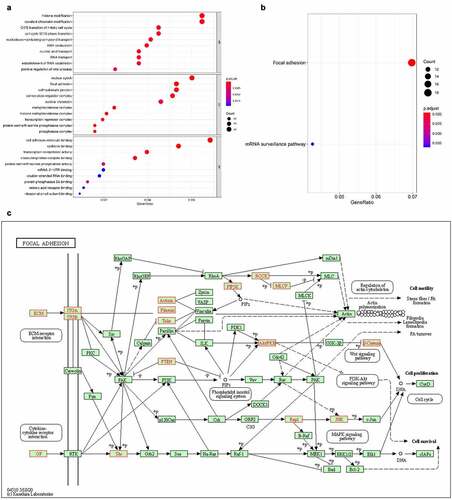
Figure 8. KEGG pathway analysis of five target genes regulated by circRNAs. the bar plot (a), dot plot (b) and related pathway (c) showed the top 10 enrichment score values of the significantly enriched pathway
Supplemental Material
Download Zip (2 MB)Data availability statement
The authors confirm that the data supporting the findings of this study are available within the article. https://pan.baidu.com/s/1RbY4bcv8Bu2jiy2YKKp1HA