Figures & data
Table 1. Sequences of NSD1 and FBXL11 specific-shRNAs
Figure 1. NSD1 displays high level in BC and is related to poor prognosis. (a) RT-qPCR of NSD1 expression in 20 pairs of BC tissues and normal tissues. (b-c) Western blotting of the protein expression of NSD1 in 20 pairs of BC and normal tissues. Protein bands of the other 19 samples are provided in the supplementary file named Figure S1. (d) Kaplan-Meier Plotter analysis of the relationship between NSD1 level and BC patient prognosis. ***p < 0.001
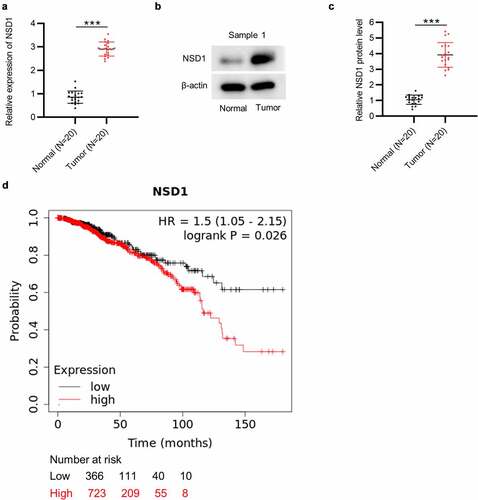
Figure 2. NSD1 is upregulated in paclitaxel-resistant BC cells. (a) CCK-8 assay for evaluating cell viability of MCF-7 and MCF-7/PR cells exposed to paclitaxel. (b) RT-qPCR analysis of NSD1 expression in MCF-7 and MCF-7/PR cells. (c) Western blotting of NSD1 protein expression in MCF-7 and MCF-7/PR cells. **p < 0.01, ***p < 0.001
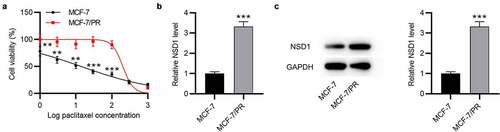
Figure 3. NSD1 knockdown suppresses the EMT, migration, invasiveness and paclitaxel resistance of BC cells. (a) Western blotting of the protein expression of NSD1 after knocking down NSD1. (b) CCK-8 assay for analyzing MCF-7/PR cell viability following the interference of NSD1. (c) Wound healing assay of the migratory ability of MCF-7 and MCF-7/PR cells after transfection of sh-NSD1 or sh-NC. (d-e) Transwell assay of the migration and invasion of MCF-7 and MCF-7/PR cells after downregulating NSD1. (f) Western blotting of the protein levels of E-cadherin, N-cadherin and Vimentin in MCF-7 and MCF-7/PR cells with transfection of sh-NSD1 or sh-NC. *p < 0.05, **p < 0.01, ***p < 0.001
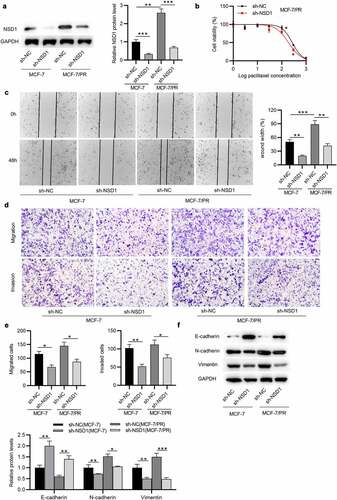
Figure 4. FBXL11 is upregulated in BC and related to poor prognosis. (a) RT-qPCR of the expression of FBXL11 in 20 pairs of BC and normal tissues. (b-c) Western blotting of the protein level of FBXL11 is 20 pairs of BC and normal tissues. Protein bands of the other 19 samples are provided in the supplementary file named Figure S1. (d) The relationship between FBXL11 level and BC patients’ prognosis examined by Kaplan-Meier Plotter. (e) The association between the expressions of NSD1 and FBXL11 in BC samples examined by GEPIA database. (f) RT-qPCR analysis of FBXL11 expression in MCF-7 and MCF-7/PR cells. (g) Western blotting of FBXL11 protein expression in BC cells. (h) CCK-8 assay for examining cell viability of MCF-7/PR with FBXL11 silencing. *p < 0.05.***p < 0.001
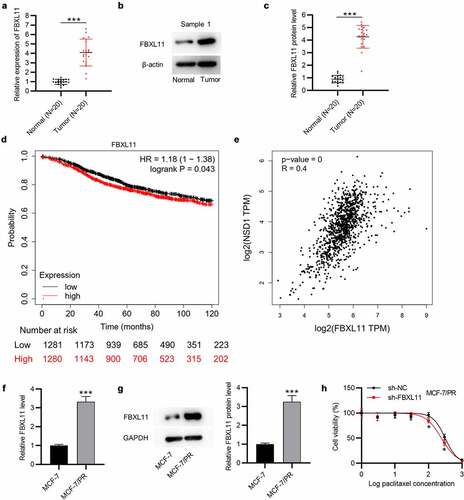
Figure 5. NSD1 and FBXL11 both regulate NF-kB. (a) Western blotting was for evaluating the protein levels of FBXL11, p65K218me and p65K221me2 after knocking down FBXL11 in MCF7/PR cells. (b) Western blotting of the protein levels of FBXL11, p65K218me and p65K221me2 after downregulating NSD1. (c-d) The luciferase reporter assay of NF-kB activity after FBXL11 and NSD1 silencing. *p < 0.05, **p < 0.01, ***p < 0.001
Figure 6. Overexpression of FBXL11 attenuates the inhibitory impact of NSD1 knockdown on the phenotypes of paclitaxel-resistant cells in vitro. (a) Western blotting of the effect of pcDNA3.1/FBXL11 on the protein level of FBXL11. (b) Wound healing assay was utilized for assessing the migratory ability of BC cells transfected with sh-NSD1, sh-NSD1+ FBXL11 or sh-NC. (c-e) Transwell assay of the migratory and invasive capabilities of BC cells with above transfection. (f) Western blotting of the protein levels of E-cadherin, N-cadherin and Vimentin. *p < 0.05, **p < 0.01, ***p < 0.001
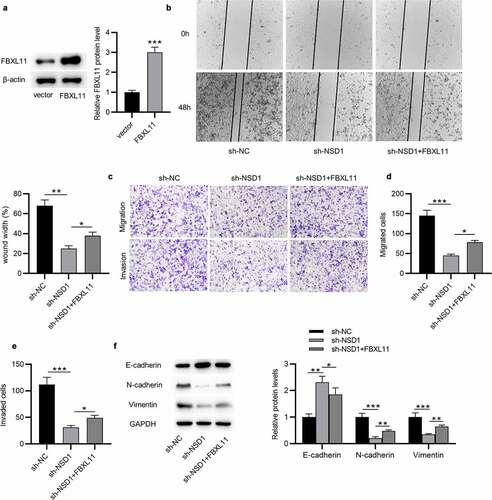
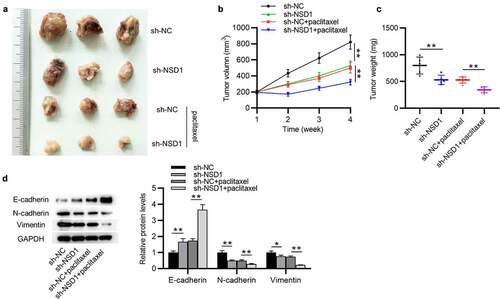
Figure 7. NSD1 promotes BC growth, EMT and paclitaxel resistance in vivo. (a) MCF-7/PR cells transfected with sh-NSD1 or sh-NC were implanted into nude mice (n = 3 each group) by subcutaneous injection. (b) Tumor volumes of every week. (c) The subcutaneous tumor weights at the 28th day after implantation. (d) Western blotting of the protein levels of E-cadherin, N-cadherin and Vimentin in surgically removed tumors. *p < 0.05, **p < 0.01