Figures & data
Figure 1. HSYA inhibits proliferation and induces apoptosis of HCT116 CRC cells
a, the chemical structure of HSYA (molecular formula C27H32O16, molecular weight 612 KD). b, HIEC and HCT116 cells were exposed to 0, 25, 50, and 100 μM HSYA for 48 h, then cell viability was measured using CCK-8 assay. c, representative images for colony formation assay of HCT116 cells that treated with 0, 25, 50, and 100 μM HSYA for 48 h (magnification, ×100). d and e, the apoptosis of HCT116 cells that treated with 0, 25, 50, and 100 μM HSYA, was observed by TUNEL staining (magnification, ×100). TUNEL-positive cells were stained with green and DAPI (blue) was used to stain the nucleus. f, the protein expression of PCNA, Bcl-2, Bax, cleaved-caspase 3/caspase 3 in HCT116 cells that treated with 0, 25, 50, and 100 μM HSYA, was detected by Western blotting assay. N = 3. **P < 0.01 and ***P < 0.001 vs Control. HSYA, Hydroxysafflor yellow A.
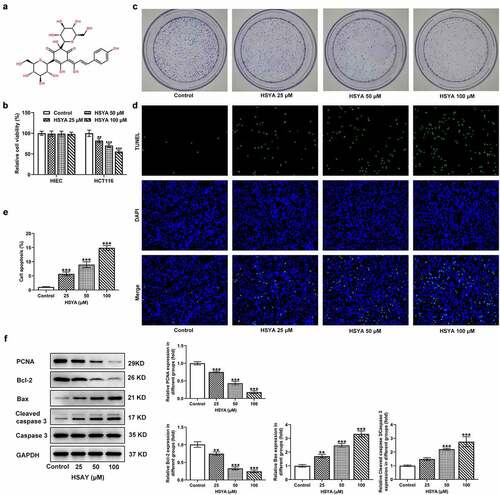
Figure 2. HSYA suppresses migration, invasion and activates PPARγ/PTEN/Akt signaling in HCT116 cells
HCT116 cells were treated with 0, 25, 50, and 100 μM HSYA for 48 h, then (a and b) cell migration was measured by wound-healing assay (magnification, ×200); (c and d) cell invasion was detected by transwell assay (magnification, ×200); (e and f) the protein expression was assessed by Western blotting assay. N = 3. *P < 0.05, **P < 0.01 and ***P < 0.001 vs Control. HSYA, Hydroxysafflor yellow A.
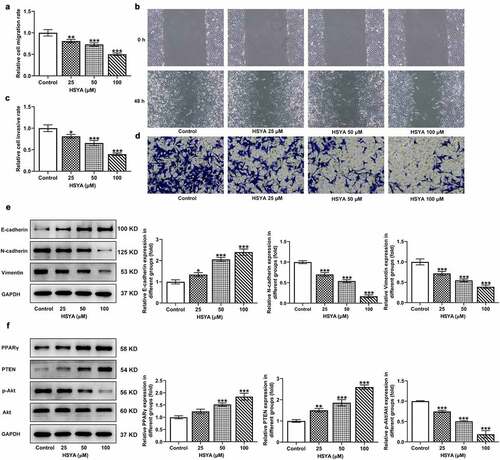
Figure 3. PPARγ down-regulation reverses the activation of HSYA on PPARγ/PTEN/Akt signaling
a, the mRNA and protein expression of PPARγ in control HCT116 cells or cells that transfection with indicated shRNAs. ***P < 0.001 vs sh-NC. b, the protein expression of PPARγ, PTEN and phosphorylated (p)-Akt/Akt in control HCT116 cells, cells that treated with 100 μM HSYA for 48 h with 2 μM GW9662 pre-treatment for 6 h or not, cells that transfection with indicated shRNAs then subjected to 100 μM HSYA treatment for 48 h. N = 3. ***P < 0.001 vs Control; ###P < 0.001 vs HSYA; ΔΔΔP < 0.001 vs HSYA + sh-NC. HSYA, Hydroxysafflor yellow A; sh, shRNA; GW9662, PPARγ antagonist.
Figure 4. PPARγ down-regulation blocks the effect of HSYA on HCT116 CRC cells proliferation, apoptosis, migration and invasion
HCT116 were treated with 100 μM HSYA for 48 h or not, pre-treated with 2 μM GW9662 for 6 h or transfected with indicated shRNAs, followed by 100 μM HSYA treatment for 48 h, then (a) cell viability was measured by CCK-8 assay; (b) colony formation was performed to observe cell proliferation (magnification, ×100); (c) TUNEL staining was utilized to explore cell apoptosis (magnification, ×100), TUNEL-positive cells were stained with green and DAPI (blue) was used to stain the nucleus; (d) cell migration was measured by wound-healing assay (magnification, ×200); (e) cell invasion was detected by transwell assay (magnification, x200). N = 3. ***P < 0.001 vs Control; #P < 0.05, ##P < 0.01 and ###P < 0.001 vs HSYA; ΔΔP < 0.01 and ΔΔΔP < 0.001 vs HSYA + sh-NC. HSYA, Hydroxysafflor yellow A; sh, shRNA; GW9662, PPARγ antagonist.
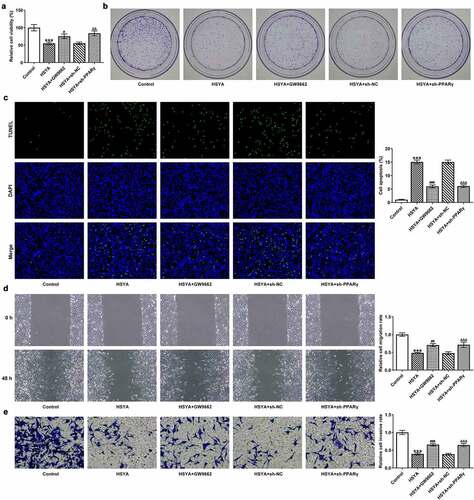
Figure 5. PPARγ down-regulation blocks the effect of HSYA on the expression of proteins related to proliferation, apoptosis and migration in HCT116 CRC cells
HCT116 were treated with 100 μM HSYA for 48 h or not, pre-treated with 2 μM GW9662 for 6 h or transfected with indicated shRNAs, followed by 100 μM HSYA treatment for 48 h, then the protein expression was assessed by Western blotting assay. N = 3. ***P < 0.001 vs Control; ###P < 0.001 vs HSYA; ΔΔΔP < 0.001 vs HSYA + sh-NC. HSYA, Hydroxysafflor yellow A; sh, shRNA; GW9662, PPARγ antagonist.