Figures & data
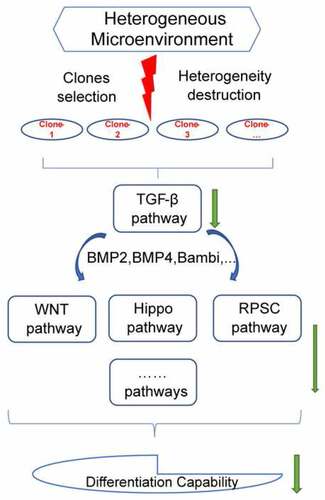
Figure 1. The selection protocol for sub-clones. (a) The selection procedure for single sub-clone. (b) Images of DFSCs and three sub-clones. (Scale bar: 100 μm). (c) Cell proliferation assay. CCK-8 assay were used to evaluate the proliferation capability of 3 sub-clones and DFSCs. Error bar indicated SEM (n = 3). DF18 showed the highest proliferation activity while DF2 stayed at a relatively quiescent level on the contrary; DF8 and DFSCs showed similar proliferation level. (d) Hierarchical clustering analysis. Hierarchical clustering of Gene Expression Array for sub-clones and DFSCs. Sub-clones and DFSCs were proved to be different cluster
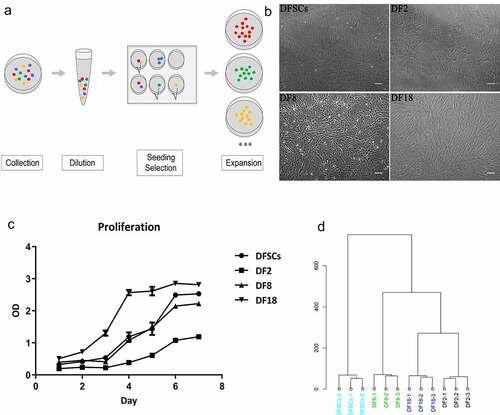
Table 1. Number of differential expression genes
Figure 2. The Volcano plot of differentially expression genes between (a) DF2 and DFSCs, (b) DF8 and DFSCs. (c) Experimental design and flow diagram. The upper part showed the DEGs were selected from three groups and then performed enrichment analysis. The lower part showed the enrichment analysis was firstly performed in different groups separately and then analyzed pathways
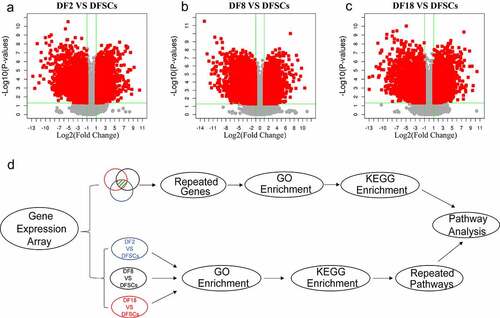
Figure 3. Screening for repeated differentially expressed genes in three groups. (a) Venn diagram. (b) Bubble plot showing results of GO term enrichment analysis of repeated differentially expressed genes. (c) Bar plot showing results of GO term enrichment analysis of repeated differentially expressed genes. (d) Heatmap of the differentially expressed genes in targeted biological processes. (e) Bubble plot showing results of KEGG term enrichment analysis of repeated differentially expressed genes. (f) Bar plot displaying results of KEGG term enrichment analysis of repeated differentially expressed genes. Red frame shows the targeted biological processes in this study. Blue frame shows the targeted signaling pathways in this study
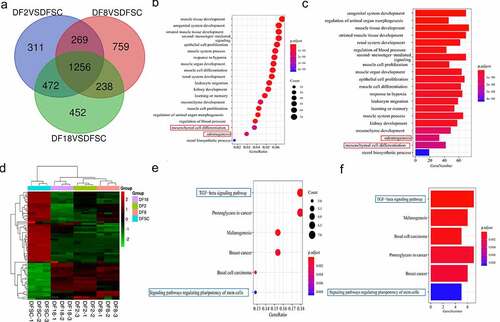
Figure 4. Screening for repeated differentially expressed genes in each group. Bubble plot for GO term enrichment of (a) DF2 VS DFSCs, (b) DF8 VS DFSCs, (c) DF18 VS DFSCs. Bubble plot for GO term enrichment of differential genes of (d) DF2 VS DFSCs, (e) DF8 VS DFSCs, (f) DF18 VS DFSCs. Red frame showed the targeted biological processes in this study
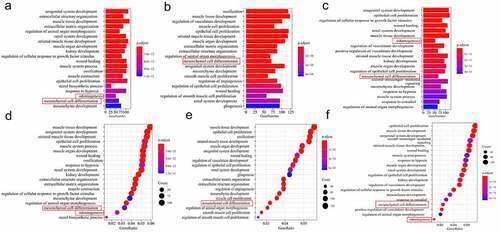
Figure 5. Differential genes expression screening respectively on signaling pathways. Heatmap of the differential genes in targeted biological processes (a) DF2 VS DFSCs; (b) DF8 VS DFSCs, (c) DF18 VS DFSCs. Bubble plot for KEGG term enrichment of (A) DF2 VS DFSCs, (B) DF8 VS DFSCs, (C) DF18 VS DFSCs. Bubble plot for KEGG term enrichment of differential genes of (d) DF2 VS DFSCs, (e) DF8 VS DFSCs, (f) DF18 VS DFSCs. Red frame showed the targeted signaling pathway in this study
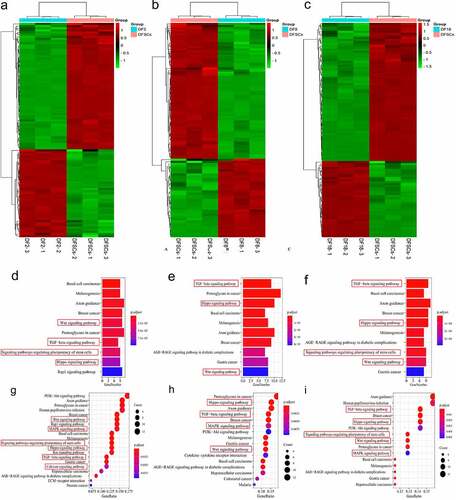
Figure 6. Interaction network analysis to DRGs by Cytoscape (a) DF2 VS DFSCs group, TGF-β signaling pathway worked with WNT signaling pathway, signaling pathways Regulating the Pluripotency of Stem Cells and Hippo pathway through Id3, Bmp4, Bmp2 and Bambi. (b) DF8 VS DFSCs group, TGF-β signaling pathway worked with WNT signaling pathway and Hippo pathway through Smad7, Bmp4, Bmp2, TGFβ2 and Bambi. (c) DF18 VS DFSCs group, TGF-β signaling pathway worked with WNT signaling pathway, signaling pathways Regulating the Pluripotency of Stem Cells and Hippo pathway through Id3, Bmp4, Bmp2 and Bambi, Smad3 and TGFβR1. (The green color represented the most enriched pathways)
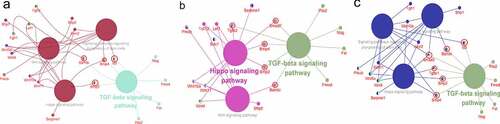
Figure 7. Validation of microarray results by qRT-PCR (a) and Western blot (b). Statistical significance used in this figure: *P < 0.05, **P < 0.01 and ***P < 0.001; ns represented no statistically significant. Error bar indicated SD (n = 3). (c) Gray analysis for Western blot. The Gray value of subclones was significantly lower than DFSCs. (d) Osteogenesis Differentiation. Calcium nodules were visualized using alizarin red after osteogenesis induction of DFSCs and sub-clones. There were fewer calcium nodules in the sub-clones. (Scale bar: 100 mm)
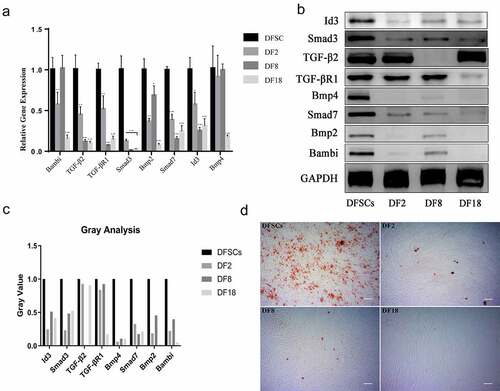
Figure 8. In vivo implantation. Left photos: DFSCs and three sub-clones were combined with TDM, and the scaffolds were implanted into sockets. Right photos: HE staining for different scaffolds. The new bone formation was observed in DFSCs + TDM group and DF2+ TDM group. (Scale bar: 100 μm)
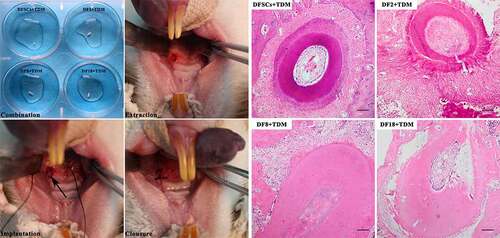
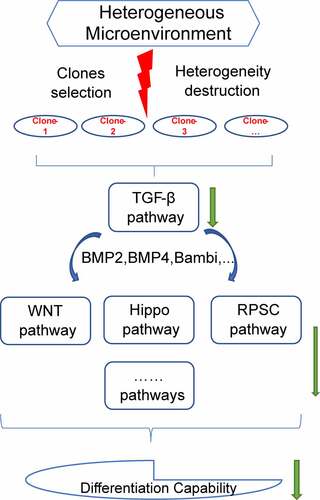
Figure 9. Study outcome. Selection of sub-clones destructed the heterogeneous microenvironment of DFSCs. The destruction of heterogeneity down-regulated TGF-β signaling pathway. TGF-β signaling pathway cross talked with Hippo signaling pathway, WNT signaling pathway, signaling pathways regulating the pluripotency of stem cells and other pathways inhibited differentiation capability of sub-clones