Figures & data
Table 1. All antibodies information and sources in Western blot in this study
Figure 1. Magnolol ameliorated the impairment of locomotor activity and cognitive function, and regulated the levels of oxidative-related factors in AD model mice with brain insulin resistance. (a-b) OFT was performed to measure the locomotor activity of the mice. (c) NOR evaluation was conducted to measure the discrimination ability of the mice. (d-f) MWM test was used to evaluate the spatial learning and memory ability of the mice. (g-i) The secretions of MDA (g), GSH (h), and SOD (i) in hippocampus tissues of the mice were detected by ELISA. (*P < 0.05, ***P < 0.001, vs. Control; ^P < 0.05, ^^P < 0.01, ^^^P < 0.001, vs. Model). (AD: Alzheimer’s disease, OFT: open-field test, NOR: novel object recognition, MWM: morris water maze, MDA: malondialdehyde, GSH: glutathione, SOD: superoxide dismutase).
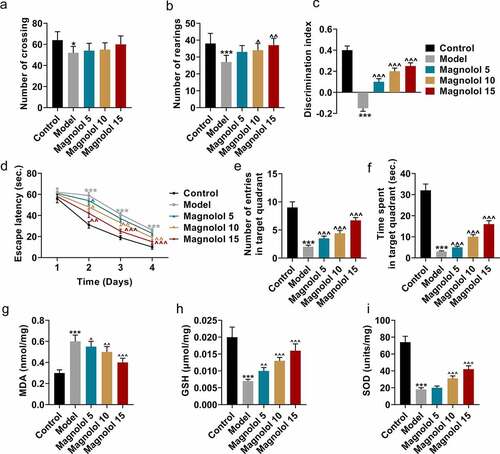
Figure 2. Magnolol down-regulated the levels of inflammation-related factors and up-regulated the level of miR-200c in AD model mice with brain insulin resistance. (a-c) The secretions of TNF-α (a), IL-6 (b), and CRP (c) in hippocampus tissues of the mouse were detected by ELISA. (d-e) The expressions of TNF-α, IL-6, and CRP in hippocampus tissues of the mice were detected by Western blot. GAPDH was used as an internal control. (f) The expression of miR-200c in hippocampus tissues of the mouse was detected by RT-qPCR, and U6 was used as an internal control. (***P < 0.001, vs. Control; ^P < 0.05, ^^P < 0.01, ^^^P < 0.001, vs. Model). (AD: Alzheimer’s disease, TNF-α: tumor necrosis factor-α, IL-6: interleukin-6, CRP: C-reactive protein).
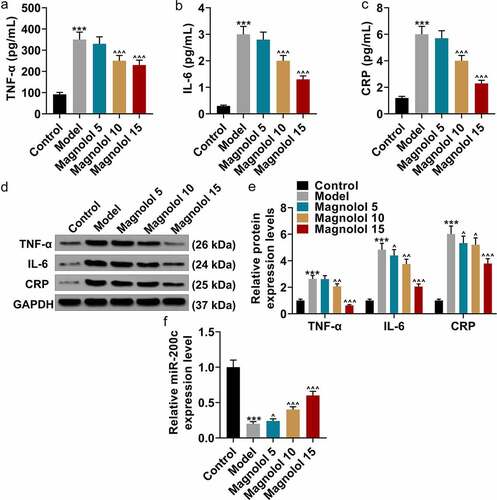
Figure 3. miR-200c antagomiR offset the effects of Magnolol on locomotor activity and cognitive function and levels of oxidative-related factors in AD model mice with brain insulin resistance. (a) The expressions of miR-200c in hippocampus tissues of the mice were quantified by RT-qPCR. U6 was used as an internal control. (b-c) OFT was performed to measure the locomotor ability of the mice. (d) NOR evaluation was employed to measure the discrimination ability of the mice. (e-g) MWM test was conducted to evaluate the spatial learning and memory ability of the mice. (h-j) The secretions of MDA (h), GSH (i), and SOD (j) in hippocampus tissues of the mice were detected by ELISA. (*P < 0.001, **P < 0.001, ***P < 0.001, vs. AntagomiR-NC; ^P < 0.05, ^^^P < 0.001, vs. AntagomiR; #P < 0.05, ##P < 0.01, ###P < 0.001, vs. AntagomiR-NC+ Magnolol 10; &P < 0.05, &&P < 0.01, &&&P < 0.001, vs. AntagomiR-NC+ Magnolol 15). (AD: Alzheimer’s disease, OFT: open-field test, NOR: novel object recognition, MWM: morris water maze, MDA: malondialdehyde, GSH: glutathione, SOD: superoxide dismutase, PCO: protein carbonylation).
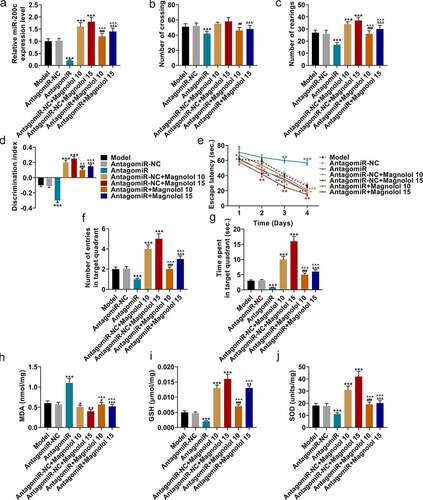
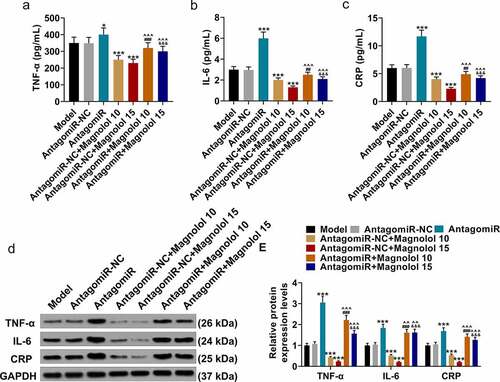
Figure 4. miR-200c antagomiR offset the effect of Magnolol on the levels of inflammation-related factors in AD model mice with brain insulin resistance. (a-c) The secretions of TNF-α (a), IL-6 (b), and CRP (c) in hippocampus tissues of the mice were detected by ELISA. (d-e) The expressions of TNF-α, IL-6, and CRP in hippocampus tissues of the mice were detected by Western blot. GAPDH was used as an internal control. (*P < 0.001, ***P < 0.001, vs. AntagomiR-NC; ^^P < 0.05, ^^^P < 0.001, vs. AntagomiR; ##P < 0.01, ###P < 0.001, vs. AntagomiR-NC+ Magnolol 10; &&&P < 0.001, vs. AntagomiR-NC+ Magnolol 15). (AD: Alzheimer’s disease, TNF-α: tumor necrosis factor-α, IL-6: interleukin-6, CRP: C-reactive protein).