Figures & data
Figure 1. LPS stimulation upregulates Hsp22 expression in C57BL/6 mice. (a) Flow diagram of animal experiment. (b) Body weight (BW) assessment once every three days. (c) The protein band of Hsp22 and its expression. *P < 0.05
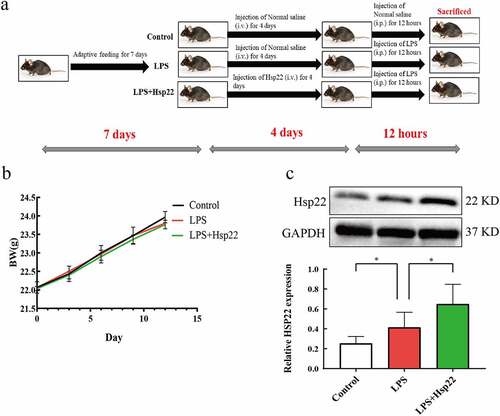
Figure 2. Hsp22 pre-treatment alleviates cardiac dysfunction induced by LPS. (a) Histological analysis of myocardial tissue via HE staining (×200). (b-c) CK-MB and LDH levels in the serum. (d) Echocardiographs. (e-f) Echocardiography parameters (EF% and FS%). *P < 0.05
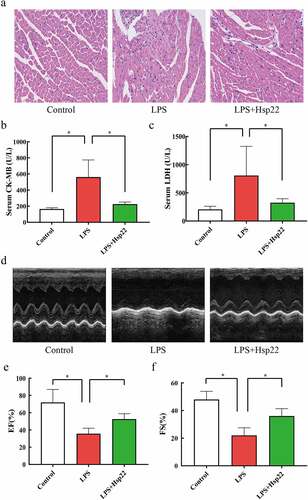
Figure 3. Hsp22 pre-treatment alleviates cardiac inflammation induced by LPS. (a-c) The serum levels of IL-1β (a), IL-6 (b), and TNF-α (c). (d) The protein band of TNF-α and its expression. (e) The protein band of NLRP3 and its expression. *P < 0.05, **P < 0.01 and ***P < 0.001
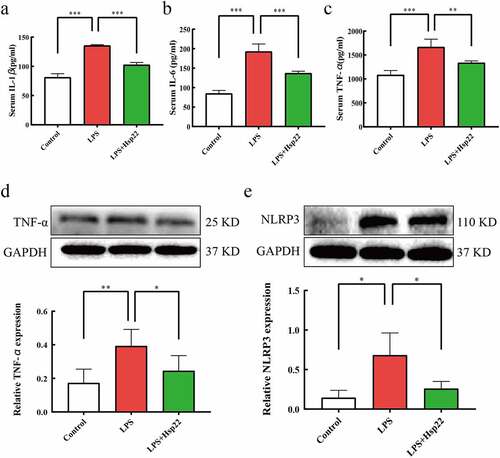
Figure 4. Hsp22 pre-treatment alleviates cardiac oxidative stress induced by LPS. (a-b) Representative images of DHE-stained heart sections (×200) (a); ROS expression levels (b).(c-d) SOD activity (c) and MDA levels (d) in mice heart tissues. *P < 0.05, **P < 0.01 and ***P < 0.001
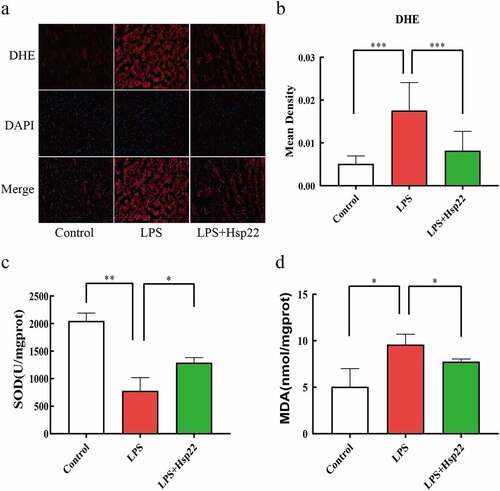
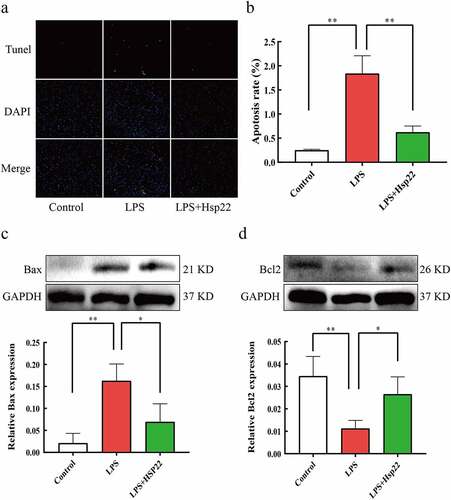
Figure 5. Hsp22 pre-treatment alleviates cardiac apoptosis induced by LPS. (a-b) Representative images of Tunel-stained heart sections (×200) (a); The number of apoptotic myocardial cells (b). (c-d) The protein band of Bax and its expression (c); The protein band of Bcl2 and its expression (d). *P < 0.05 and **P < 0.01