Figures & data
Table 1. Clinical characteristics of 30 cholangiocarcinoma patients
Table 2. The primers used in the presence work
Figure 1. The identification of TTN-AS1/miR-513a-5p/SFN axis in cholangiocarcinoma. (a) The expression of TTN-AS1 in cholangiocarcinoma based on GEPIA data. T, tumor. N. normal. (b) The upregulated genes from GEPIA were performed the GO enrichment by STRING. (c-d) The expression of SFN and CDKN2A in tumor tissues (N = 30) and normal tissues (N = 30). **P < 0.01 vs. normal control group. (e) The miRNAs targeting TTN-AS1 and SFN were predicted by starBase and TargetScan. (f) The enrichment of TTN-AS1 in four miRNAs was detected by RIP assay. **P < 0.01 vs. anti-IgG group
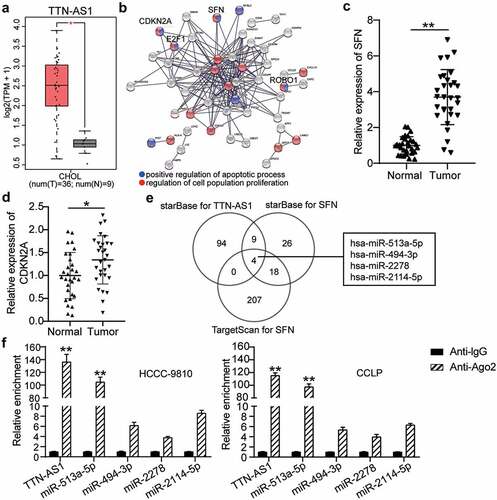
Figure 2. Silencing of TTN-AS1 inhibited the proliferation and migration of cholangiocarcinoma cells. (a) The subcellular localization of TTN-AS1 in CCLP and HCCC-9810 cells. (b) The RT-qPCR detection of TTN-AS1 level in tumor tissues (N = 30) and normal samples (N = 30) from cholangiocarcinoma patients. **P < 0.01 vs. normal control group. (c) The expression of TTN-AS1 in cholangiocarcinoma cells (TFK-1, CCLP, HCCC-9810 and HUCCT1) and biliary epithelia HIBEC. **P < 0.01 vs. HIBEC. (d) The transfection efficiency of sh-TTN-AS1 was measured by RT-qPCR. **P < 0.01 vs. sh-NC group. (e) The proliferation of CCLP and HCCC-9810 cells was detected by CCK-8 assay. vs. sh-NC group, **P < 0.01. (f) The EdU percentage of CCLP and HCCC-9810 cells was detected by EdU assay. **P < 0.01 vs. sh-NC group. (g) Transwell assay was conducted to estimate cell migration. (h) The volume and weight of tumors were detected after 5 weeks of xenograft. *P < 0.05, **P < 0.01 vs. sh-NC group
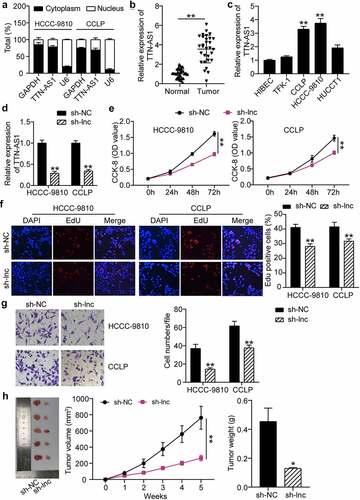
Figure 3. TTN-AS1 was a miRNA sponge for miR-513a-5p. (a) The potential binding sites between TTN-AS1 and miR-513a-5p. (b) Dual-luciferase reporter assay was adopted to confirm the predicted relationship. **P < 0.01 vs. miR-NC group. (c) The expression of miR-513a-5p in normal cells and cholangiocarcinoma cells. **P < 0.01 vs. HIBEC. (d) The RT-qPCR analysis of miR-513a-5p level in clinical specimens. **P < 0.01 vs. normal control group. (e) Pearson correlation analysis of TTN-AS1 and miR-513a-5p
Figure 4. Suppression of miR-513a-5p abolished the role of TTN-AS1 knockdown in cholangiocarcinoma cell proliferation and migration. (a) The effects of TTN-AS1 on miR-513a-5p expression was evaluated by RT-qPCR. (b) CCK-8 assay was performed to determine the role of miR-513a-5p in cell proliferation. (c) The EdU percentage of CCLP and HCCC-9810 cells regulated miR-513a-5p was detected by EdU assay. (d) The potential of miR-513a-5p in cell migratory capability was assessed by transwell assay. **P < 0.01 vs. sh-NC group. &&P < 0.01 vs. inhibitor-NC. ##P < 0.01 vs. sh-lnc+inhibitor
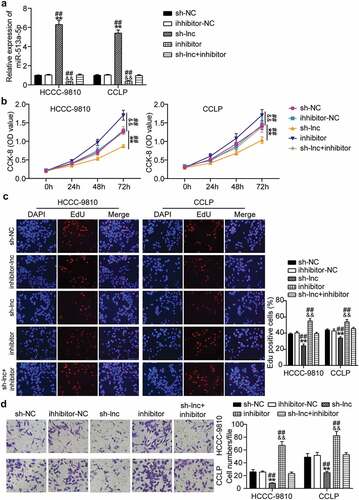
Figure 5. SFN acted as a downstream effector of miR-513a-5p. (a) The predicted miR-513a-5p binding sites in 3ʹUTR of SFN. (b) The interplay of miR-513a-5p and SFN was validated by dual-luciferase reporter assay. vs. miR-NC group, **P < 0.01. (c) The expression of SFN in normal cells HIBEC as well as cholangiocarcinoma cells CCLP and HCCC-9810. vs. HIBEC, **P < 0.01. (d) Pearson correlation analysis of SFN and miR-513a-5p
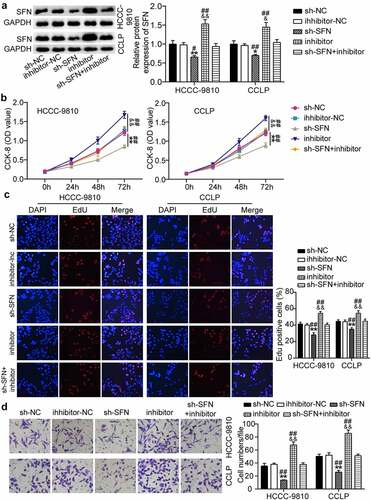
Figure 6. SFN was responsible for the function of miR-513a-5p in the malignant behaviors of cholangiocarcinoma cells. (a) RT-qPCR analysis was employed to detect the impacts of miR-513a-5p on SFN expression. (b) The influences of SFN on cell proliferation were identified by CCK-8 assay. (c) The EdU percentage of CCLP and HCCC-9810 cells regulated SFN was detected by EdU assay. (d) Transwell assay was conducted to ascertain the role of SFN in cell migration. *P < 0.05, **P < 0.01 vs. sh-NC group. &&P < 0.01 vs. inhibitor-NC. ##P < 0.01 vs. sh-SFN+inhibitor