
Figures & data
Figure 1. OTUB1 is overexpressed in glioma patients and predicts a poor survival. (a – c) OTUB1 expression was analyzed in GEO datasets (GSE100675, GSE117423, GSE65626). (d) OTUB1 expression was examined in clinical samples. (e) OTUB1 protein was detected in clinical samples through IHC assay. (f – h) The correlation between the overall survival of glioma patients and OTUB1 expression was determined through online datasets (R2: Genomics Analysis and Visualization Platform)
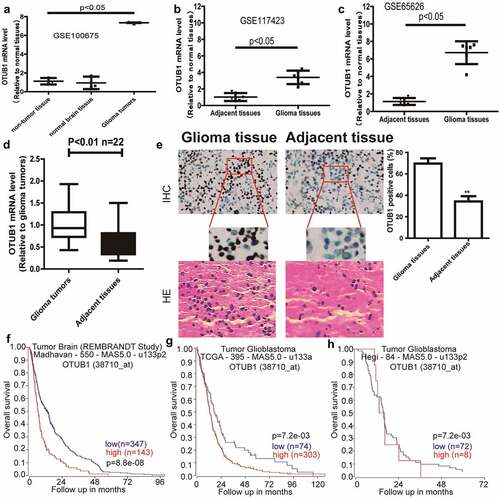
Figure 2. Knockdown of OTUB1 reduces glioma stemness. (a) Different glioma cell lines were subjected to detect OTUB1 protein level. (b) The knockdown efficiency of Si-OTUB1 was confirmed in U87 and U251 cells. (c – f) U87 and U251 cells with or without OTUB1 knockdown were subjected to determine stemness markers’ expression. (g and h) U87 and U251 cells with or without OTUB1 knockdown were subjected to evaluate tumor sphere number and size, and the expression of stemness markers using in situ immunostaining. (i) ALDH activity was measured in U251 and U87 cells with or without OTUB1 knockdown. n = 3, **P < 0.01 vs. Control
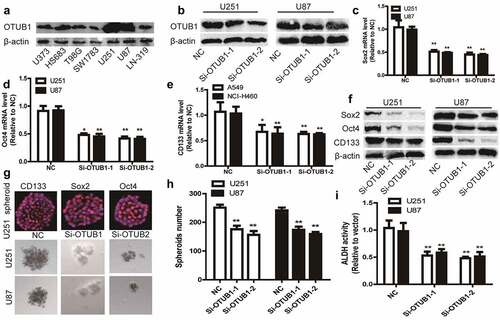
Figure 3. OTUB1 stabilizes SLC7A11 protein through directly interacting with it. (a) The OTUB1-SLC7A11 interaction was evaluated in U87 and U251 cells via co-IP assay. (b) U87 and U251 cells with OTUB1 knockdown or overexpression were subjected to detect SLC7A11 protein level. (c) U87 and U251 cells with OTUB1 overexpression were subjected to examine SLC7A11 protein level after being treated with CHX or not. (d) U87 and U251 cells with OTUB1 knockdown or overexpression were used to evaluate the ubiquitination of SLC7A11. (e) SLC7A11 protein level was determined in U87 and U251 cells with OTUB1 knockdown plus MG132 treatment or not. n = 3. (f) In situ staining for co-localization of OTUB1 and SLC7A11 in U87 cells
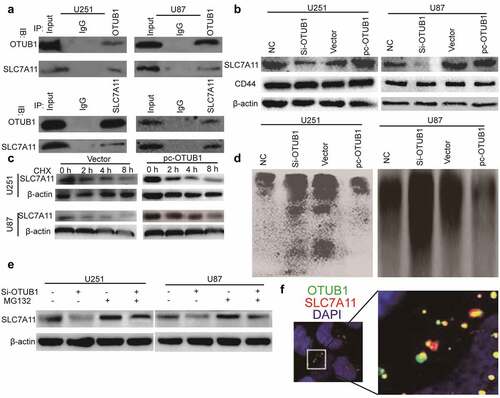
Figure 4. OTUB1 knockdown triggers ferroptosis dependent on SLC7A11 expression. (a) OTUB1 and SLC7A11 protein level was examined in U87 and U251 cells with OTUB1 knockdown as well as SLC7A11 overexpression or not. (b) The cysteine concentration was measured in U87 and U251 cells with OTUB1 knockdown as well as SLC7A11 overexpression or not. (c) Glutathione level was detected in U87 and U251 cells with OTUB1 knockdown as well as SLC7A11 overexpression or not. (d) ROS level was determined in U87 and U251 cells with OTUB1 knockdown as well as SLC7A11 overexpression or not. n = 3, **P < 0.01 vs. Control
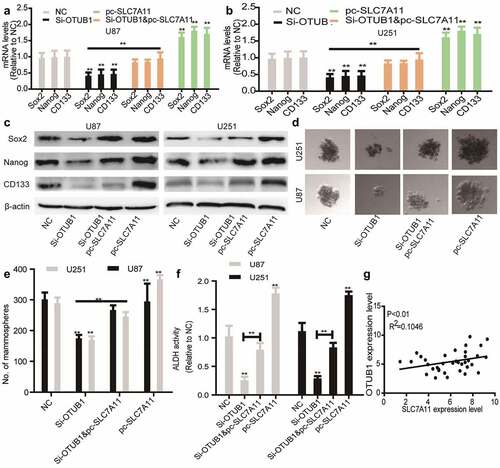
Figure 5. SLC7A11 overexpression rescues the inhibition of OTUB1 knockdown on the stemness of glioma cells. (a) Stemness markers’ mRNA levels were examined in U87 cells with OTUB1 knockdown plus SLC7A11 overexpression or not. (b) Stemness markers’ mRNA levels were detected in U251 cells with OTUB1 knockdown as well as SLC7A11 overexpression or not. (c) Stemness markers’ protein expression was measured in the cells depicted in (A) and (B). (d and e) The tumor sphere number and size were determined in the cells described in (A) and (B). (f) ALDH activity was tested in the cells described in (A) and (B). (g) The correlation between OTUB1 and SLC7A11 expression was evaluated in glioma tissues. n = 3, **P < 0.01 vs. Control
Supplemental Material
Download Zip (7.8 KB)Data availability statement
All data generated or analyzed during this study are included in this published article and its supplementary data.