Figures & data
Figure 1. The average age and gender distribution of patients with nucleus pulposus removal.
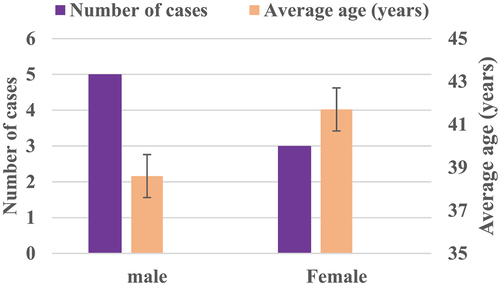
Figure 2. Distribution of nucleus pulposus removal site of patients.
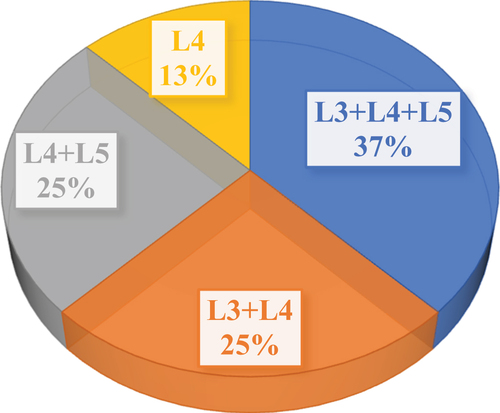
Figure 3. Microscopic image of nucleus pulposus cells in the first transfer generation.
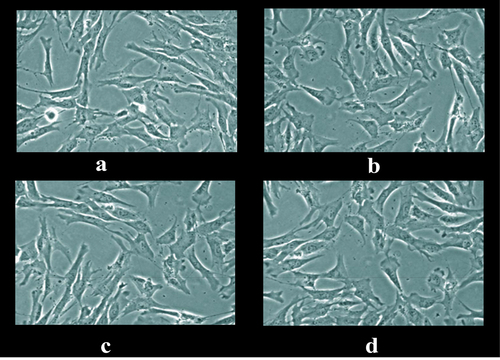
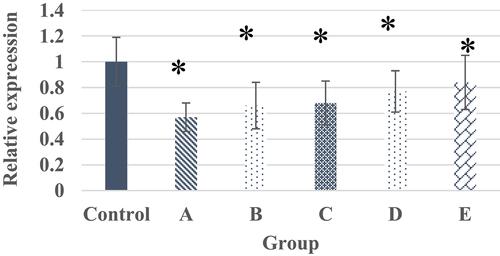
Figure 4. CD24 and FBLN1 gene expression results in myeloid cells.
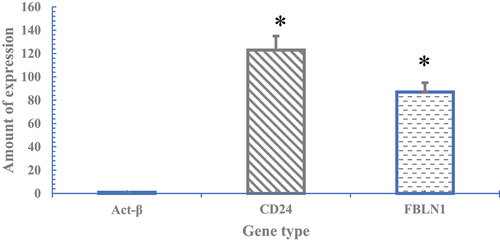
Figure 5. CCK-8 OD values of nucleus pulposus cells with different concentrations of α2 MG in each period of culture.
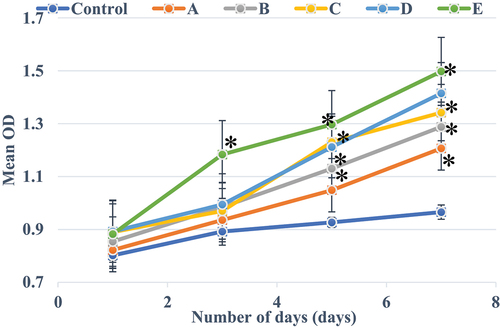
Figure 6. The morphology of nucleus pulposus cells in each culture period.
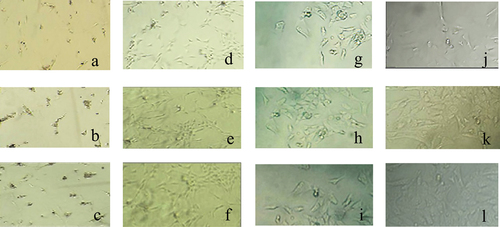
Figure 7. Comparison on SOA content in each group of patients.
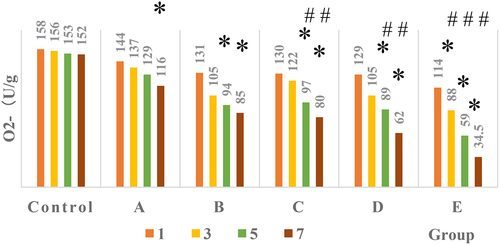
Figure 8. The SOD activity curve of nucleus pulposus cells in each culture period.
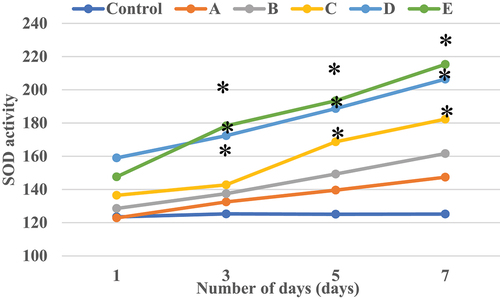
Figure 9. The electrophoresis results of each group of samples.
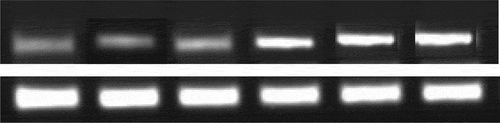
Figure 10. The target protein content of each group of samples.