1,741
Views
4
CrossRef citations to date
0
Altmetric
Research Paper

MicroRNA (miR)-590-3p alleviates high-glucose induced renal tubular epithelial cell damage by targeting C-X3-C motif chemokine ligand 1 (CX3CL1) in diabetic nephropathy

, , , , , , & ORCID Icon show all
Pages 634-644 | Received 01 Sep 2021, Accepted 25 Nov 2021, Published online: 30 Dec 2021

Figures & data

Table 1. Comparison of the baseline data of subject

Figure 1. Expression and clinical correlation analysis of miR-590-3p in participants. (a) Compared with healthy controls and T2DM patients, miR-590-3p is marked to be reduced in DN patients. Spearman correlation coefficient analysis of serum miR-590-3p and DN clinical index (b) Albuminuria (c) eGFR. note: compared with healthy, *** means P < 0.001; Compared with T2DM, ### means P < 0.001.

Figure 1. Expression and clinical correlation analysis of miR-590-3p in participants. (a) Compared with healthy controls and T2DM patients, miR-590-3p is marked to be reduced in DN patients. Spearman correlation coefficient analysis of serum miR-590-3p and DN clinical index (b) Albuminuria (c) eGFR. note: compared with healthy, *** means P < 0.001; Compared with T2DM, ### means P < 0.001.

Figure 2. To evaluate the diagnostic ability of serum miR-590-3p for DN. (a) miR-590-3p can significantly identify DN patients from healthy individuals. The AUC of ROC was 0.958, the sensitivity was 92.90% and the specificity was 87.23%. (b) miR-590-3p could distinguish DN patients from T2DM patients, and the AUC of ROC was 0.859, the sensitivity and the specificity were 92.0% and 82.98%, respectively.
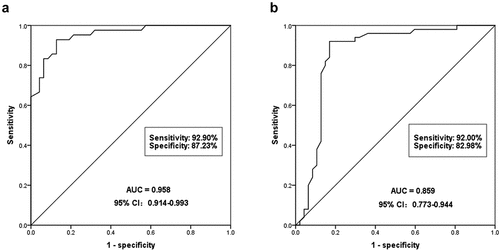
Figure 2. To evaluate the diagnostic ability of serum miR-590-3p for DN. (a) miR-590-3p can significantly identify DN patients from healthy individuals. The AUC of ROC was 0.958, the sensitivity was 92.90% and the specificity was 87.23%. (b) miR-590-3p could distinguish DN patients from T2DM patients, and the AUC of ROC was 0.859, the sensitivity and the specificity were 92.0% and 82.98%, respectively.

Figure 3. Effects of miR-590-3p level on HG-induced HK-2 proliferation, apoptosis and ROS damage. (a) mRNA levels of miR-590-3p at HG concentration gradient (0, 10, 20, 30, 40 mM). (b) miR-590-3p mRNA levels at 30 mM HG-induced under time gradient (0, 12, 24, 48 h). (c) The miR-590-3p mRNA levels of transfected with miR-590-3p mimic under HG-induced in the HK-2 cells. The elevated miR-590-3p regulates HG-induced cell proliferation (d), apoptosis (e), and oxidative stress (f). Note: Compared with 0 mM or 0 h or control, * means P < 0.05, ** means P < 0.01, *** means P < 0.001; Compared with HG + mimic NC, ## means P < 0.01; ### means P < 0.001.
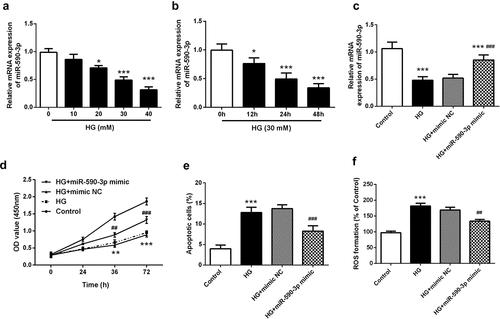
Figure 3. Effects of miR-590-3p level on HG-induced HK-2 proliferation, apoptosis and ROS damage. (a) mRNA levels of miR-590-3p at HG concentration gradient (0, 10, 20, 30, 40 mM). (b) miR-590-3p mRNA levels at 30 mM HG-induced under time gradient (0, 12, 24, 48 h). (c) The miR-590-3p mRNA levels of transfected with miR-590-3p mimic under HG-induced in the HK-2 cells. The elevated miR-590-3p regulates HG-induced cell proliferation (d), apoptosis (e), and oxidative stress (f). Note: Compared with 0 mM or 0 h or control, * means P < 0.05, ** means P < 0.01, *** means P < 0.001; Compared with HG + mimic NC, ## means P < 0.01; ### means P < 0.001.

Figure 4. miR-590-3p level affected HG-induced inflammation in HK-2 cells. (a) IL-6, (b) IL-18, and (c) TNF-α were increased in the HG-induced group, and (d) IL-10 was lower by the HG-induced. However, elevated miR-590-3p signature alleviates the levels of these inflammatory factors. Note: Compared with NG group, *** means P < 0.001; Compared with HG + mimic NC group, ### means P < 0.001.
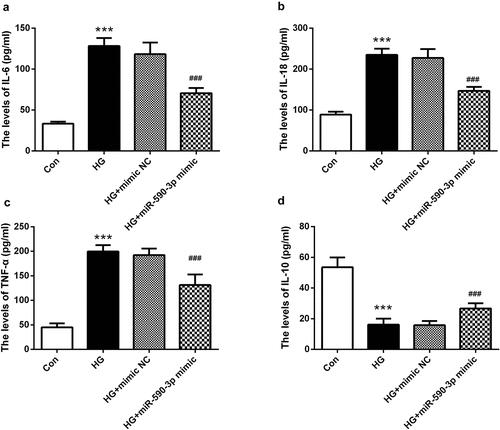
Figure 4. miR-590-3p level affected HG-induced inflammation in HK-2 cells. (a) IL-6, (b) IL-18, and (c) TNF-α were increased in the HG-induced group, and (d) IL-10 was lower by the HG-induced. However, elevated miR-590-3p signature alleviates the levels of these inflammatory factors. Note: Compared with NG group, *** means P < 0.001; Compared with HG + mimic NC group, ### means P < 0.001.

Figure 5. CX3CL1 was the target of miR-590-3p in DN. (a) Predicted binding sites analyzed by online software. (b) The consequence miR-590-3p mimic on luciferase activity in the recombinant plasmid was examined by luciferase assay. (c) Serum CX3CL1 mRNA levels in DN patients. (d) Correlation analysis of miR-590-3p and CX3CL1 in patients’ serum. (e) miR-590-3p can regulate the mRNA levels of CX3CL1 in HK-2. Note: compared with mimic NC or healthy, *** means P < 0.001; compared with inhibitor NC, ### means P < 0.001.
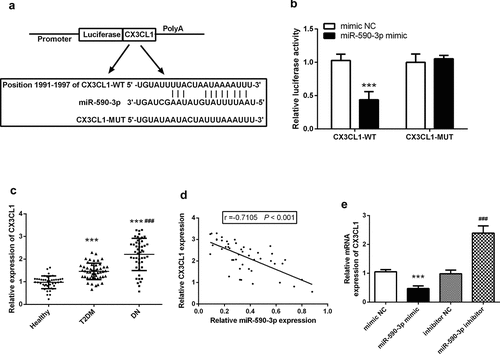
Figure 5. CX3CL1 was the target of miR-590-3p in DN. (a) Predicted binding sites analyzed by online software. (b) The consequence miR-590-3p mimic on luciferase activity in the recombinant plasmid was examined by luciferase assay. (c) Serum CX3CL1 mRNA levels in DN patients. (d) Correlation analysis of miR-590-3p and CX3CL1 in patients’ serum. (e) miR-590-3p can regulate the mRNA levels of CX3CL1 in HK-2. Note: compared with mimic NC or healthy, *** means P < 0.001; compared with inhibitor NC, ### means P < 0.001.